

Iowa Cash Receipts Revised Down for 2023
by Patricia Batres-Marquez, Senior Research Analyst
In the first farm income projections for 2025, the USDA reported an increase of $41.0 billion in U.S. net farm income to $180.1 billion (nominal terms), up by $139.1 billion, which is the current forecast for 2024. The inflation-adjusted net farm income is expected to increase by $37.7 billion in 2025 compared with 2024. This forecast indicates net farm income would be up 14.6% compared with its five-year average, $157.1 billion, yet down 8.9% from 2022’s record high in inflation-adjusted value ($197.77 billion).
According to USDA, net cash farm income is projected to increase to $193.7 billion in 2025, which would be up 21.7% year-over-year (see Figure 1). Net cash farm income includes cash receipts from farming, cash-related income, and federal government payments minus cash expenses.
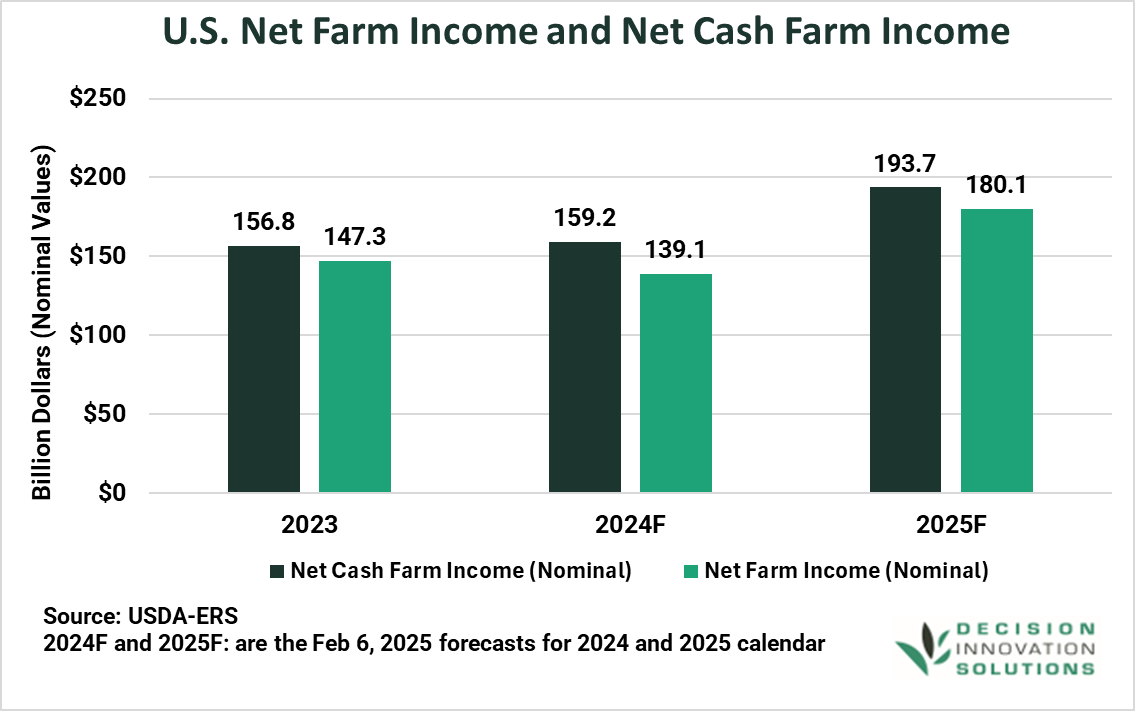
Figure 1. U.S. Net Farm Income and Net Cash Farm Income
Cash receipts generated by the sale of agricultural commodities are forecasted at $515.0 billion, in nominal terms, in 2025, down by $1.8 billion (0.3%) year-over-year (see Figure 2). According to USDA, the decline is due to expected reductions in crop receipts. Crop cash receipts are forecast to decrease by $5.6 billion (2.3%) to $239.6 billion from the 2024 forecast ($245.2 billion). The expected decline in crop cash receipts would have a direct impact on Iowa’s crop cash receipts as corn and soybean crops lead the forecast of lower crop cash receipts in 2025. The forecast for animal/animal products receipts in 2025 indicates an increase of $3.8 billion (1.4%) to $275.4 billion relative to the forecast for 2024. This forecast is based on expected increases in receipts for hogs, milk, and broilers. Hence, Iowa’s hogs cash receipts are expected to increase in 2025. Iowa is the leading hog producer in the country.
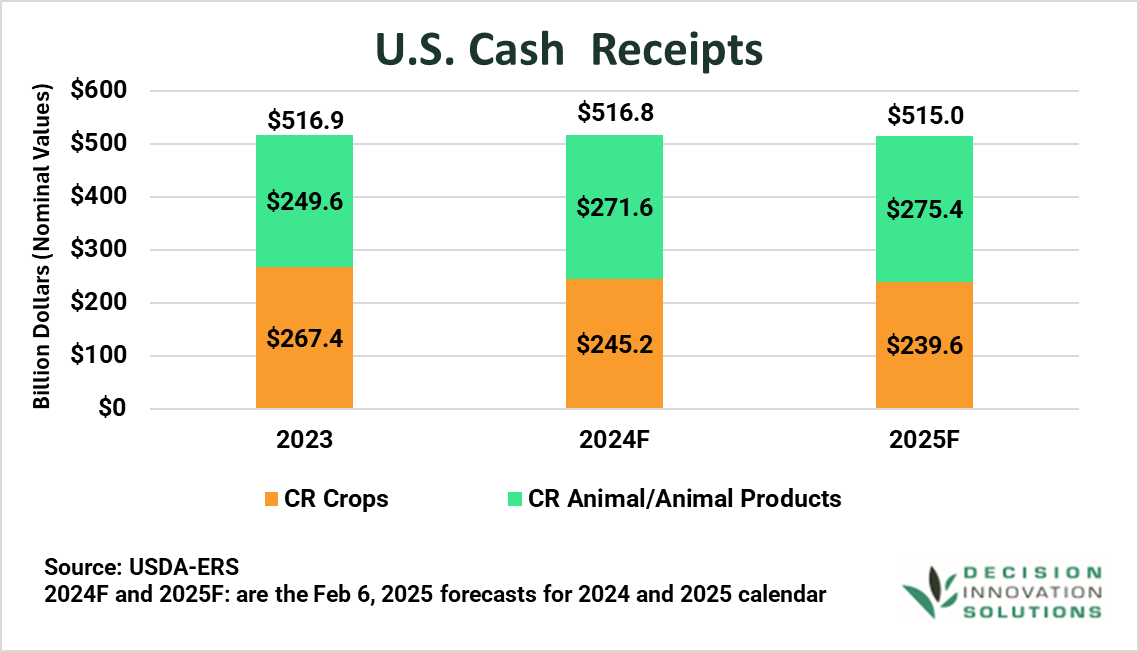
Figure 2. U.S. Cash Receipts
USDA forecasts an expansion on Direct Government payments by $33.1 billion (354.5%) to $42.4 billion in 2025 from 2024 ($9.3 billion). This forecast is based on supplemental and ad hoc disaster assistance to farmers and ranchers from the American Relief Act of 2025, which Congress enacted on December 21, 20241. Also, USDA forecasts a decline in total production expenses (including operator dwellings) in 2025. The forecast indicates a decline of $2.5 billion (0.6%) to $450.4 billion. Feed, fertilizer (including lime and soil conditioners), and pesticide expenses are forecast to see reductions in 2025. Relative to the projections for the previous year, feed expenses are forecast to decline 10.1% to $62.43 billion in 2025, while fertilizer expenses are expected to fall 11.1% to $29.24 billion. Pesticide expenses are forecast at $18.14 billion in 2025, down from $19.3 billion in 2024.
Iowa Data Revisions
Forecasts and estimates published by USDA are subject to revisions/updates2. The USDA’s February 2025 release of farm income information contained a revision of 2023 data. This revision includes state cash receipt data for 2023, which was originally published in September 2024. According to the latest revision, Iowa’s total cash receipts for 2023 ($38.75 billion) are down 4.9% from the September estimate. Although animal and product cash receipts remained as reported in September 2024 ($18.13 billion), crop cash receipts for 2023 were revised down by $2.003 billion (8.9%) to $20.62 billion relative to the estimate in September 2024 ($22.62 billion).
The corn cash receipt estimate fell from $14.07 billion to $12.92 billion (8.2%). The soybean cash receipt estimate dropped from $8.14 billion to $7.29 billion (10.5%) between the two publications. According to USDA, the revisions for corn and soybeans were based on new data from USDA’s National Agricultural Statistics Service (NASS) on the percentage of crop sales marketed by month. The data indicated that a smaller share of the 2023/24 crop year production was sold in the 2023 calendar year than previously expected.
Table 1 shows Iowa’s corn and soybean cash receipts adjustments. Overall, the new Iowa’s total cash receipts in 2023 were down 13.5% to $38.75 billion compared with the estimate in 2022 ($44.82 billion).
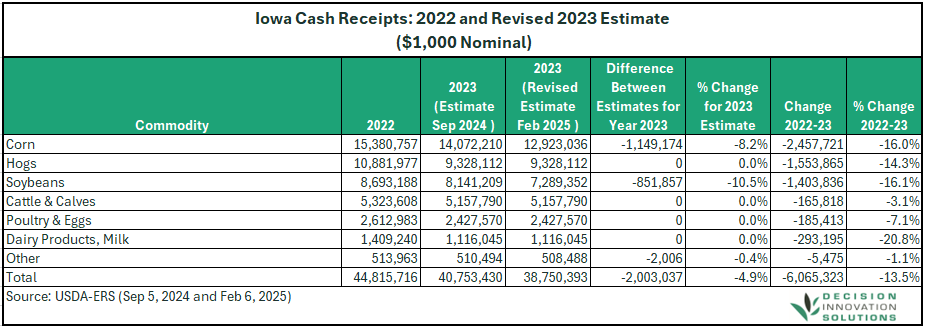
Table 1. 2023 Revised Iowa Cash Receipts ($1,000 Nominal)
The 2024 Iowa’s cash receipts for corn, hogs, soybeans, and cattle & calves were estimated based on Iowa’s last three years share of U.S. receipts for the corresponding commodity multiplied by the 2024 U.S. value forecast published in February 2025 by USDA. Iowa’s 2024 corn ($10.86 billion) and soybean ($6.42 billion) cash receipts would fall from the latest estimates in 2023 (see Figure 3). In contrast, cash receipts for hogs ($9.97 billion) and cattle & calves ($6.12 billion) in 2024 would increase year-over-year.
Note that USDA will not publish the first state-level cash receipt forecasts for 2024 until September 2025.
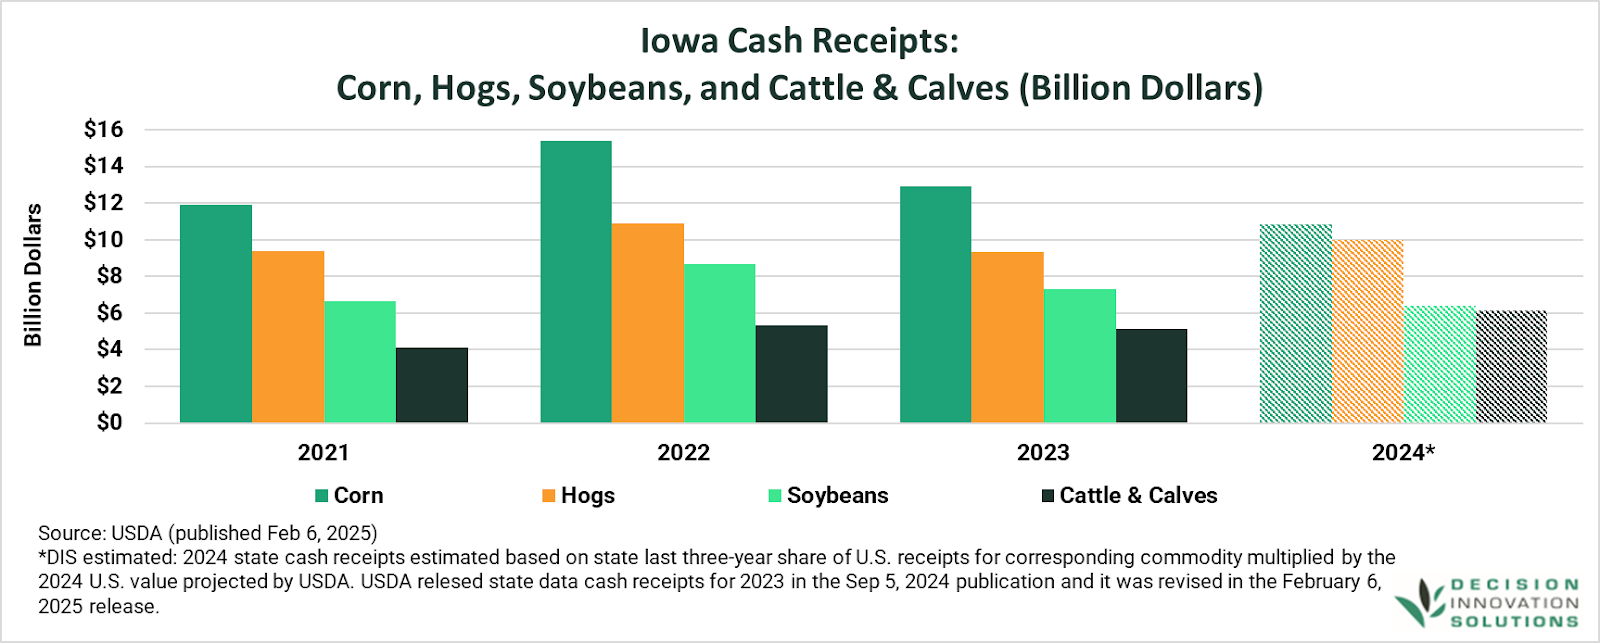
Figure 3. Iowa Cash Receipts: Corn, Hogs, Soybeans, and Cattle and Calves (Billion Dollars)
Based on the latest state-level data available, Table 2 shows Iowa’s farm income data components to compute some farm income indicators, such as net cash farm income and net farm income. Iowa’s net cash farm income deteriorated in 2023 ($9.8 billion) compared with 2022 ($17.7 billion). As shown above, net cash farm income includes cash receipts from farming, as well as federal government payments3 and cash farm-related income4 minus cash expenses (excluding depreciation and perquisites to hired labor and farm household expenses). On the other hand, net farm income comprises noncash items (including changes in inventories, economic depreciation, and gross imputed rental income of operator dwellings). Net farm income is estimated as the difference between total gross farm income (i.e., sum of gross cash income,nonmoney income, value of inventory adjustments) minus total expenses. In 2023, Iowa’s total gross farm income declined 7% to $44.9 billion year-over-year, while total expenses increased 5% to $35.4 billion, which reduced Iowa’s net farm income by 36% to $9.6 billion in 2023 compared with 2022 ($14.9 billion). The Iowa farm income statement for 2024 will be estimated when new data is published in September 2025.
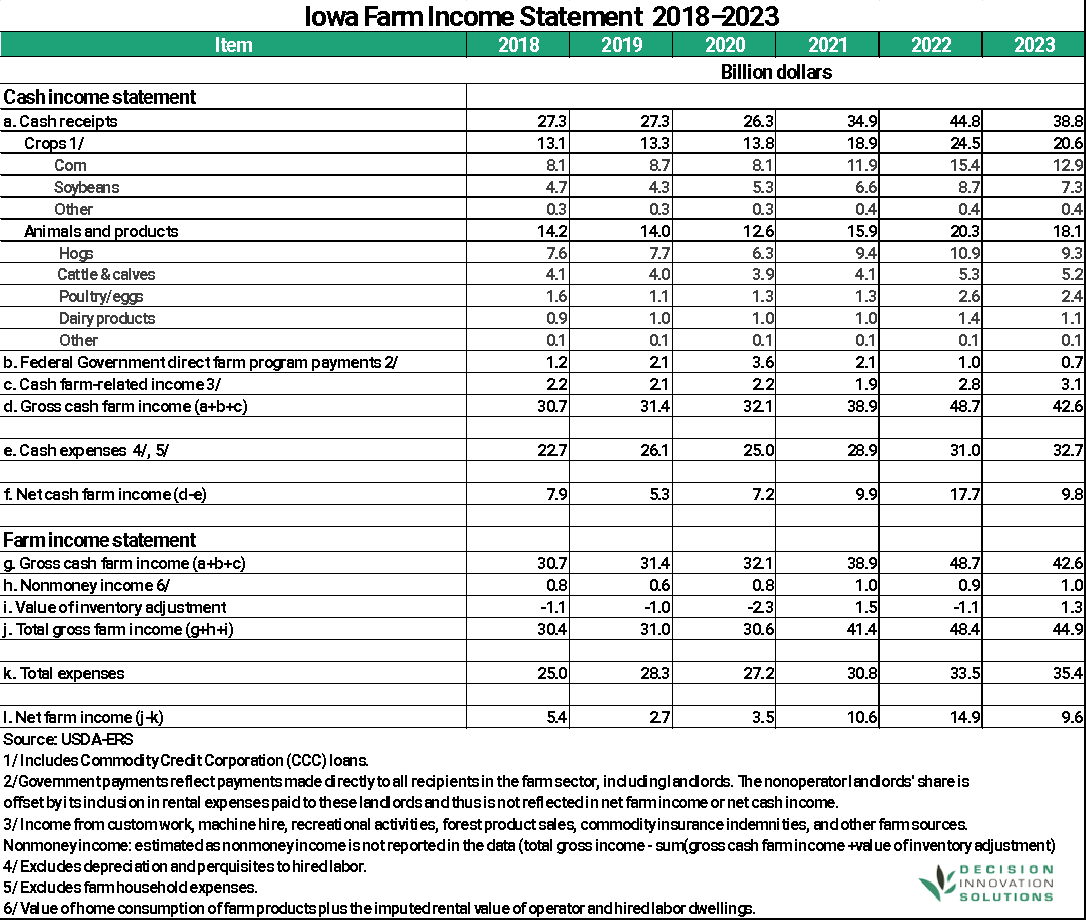
Table 2. Iowa Farm Income Statement 2018-2023
- https://www.calt.iastate.edu/blogpost/american-relief-act-2025-provides-ad-hoc-relief-farmers-while-extending-farm-bill ↩︎
- According to the USDA, statistics on farm sector income and finances are developed by using data from multiple sources including administrative and survey data. Farm income forecasts are updated three times each year (early February, late August/early September, and late November/early December), and historical estimates are revised as needed to show newly available administrative and survey data, or when estimation procedures are revised.
↩︎ - Government payments reflect payments made directly to all recipients in the farm sector, including landlords. The nonoperator landlords’ share is offset by its inclusion in rental expenses paid to these landlords and thus is not reflected in net farm income or net cash income.
↩︎ - Cash farm-related income: Income from custom work, machine hire, recreational activities, forest product sales, commodity insurance indemnities, and other farm sources.
↩︎