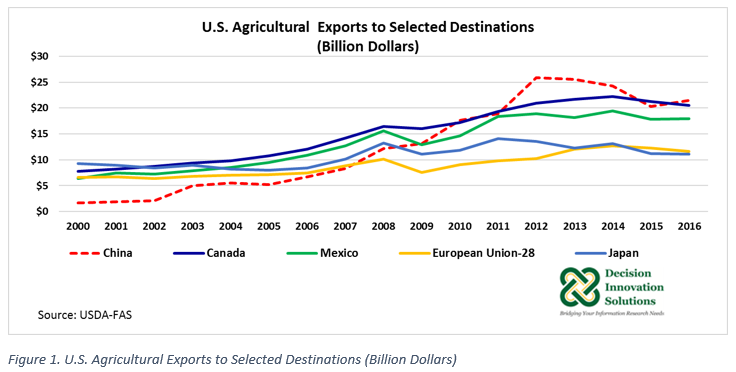
In 2016, Mexico was the third largest value market for U.S. agricultural products, after China and Canada (see Figure 1). Trade between the United States and Mexico has increased since the North American Free Trade Agreement (NAFTA) was implement on January 1, 1994. The 2016 value of U.S. agricultural exports to Mexico was up 0.8% to $17.9 billion from 2015, but down 7.9% compared with the record value in 2014 ($19.5 billion). This was the lowest export value since 2010 ($14.6 billion) (see Figure 1). Nonetheless, the value of agricultural exports to Mexico in 2016 represented 13.2% of total U.S. agricultural exports last year.
U.S. Agricultural Trade Balance with Mexico
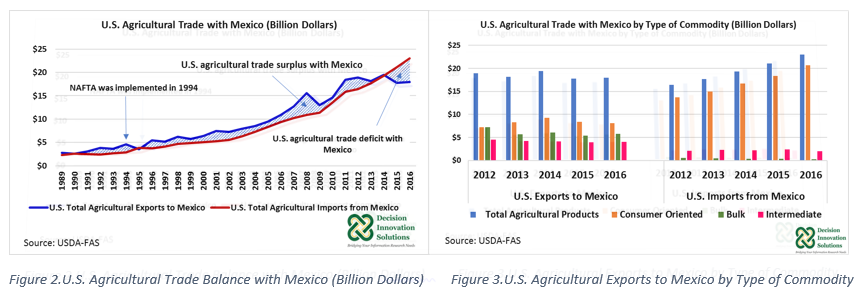
Mexico is the top agricultural supplier of agricultural commodities to the United States. Figure 2 shows that since 2015, the United States has been a net importer of agricultural products from Mexico. In 2016, the value of U.S. agricultural imports from Mexico increased 9.1% to $23.0 billion, resulting in a U.S. agricultural trade deficit with Mexico of $5.1 billion. As Figure 2 indicates, consumer-oriented agricultural commodities are the largest components in the agricultural trade between the United States and Mexico. From 2012 to 2016, on average, 86.6% ($16.9 billion) of U.S. total agricultural imports from Mexico ($19.5 billion) were consumer-oriented agricultural products. The top two consumer oriented agricultural products imported from Mexico from 2012 to 2016 were fresh vegetables ($4.7 billion, 24.3%, on average, of total U.S. agricultural imports from Mexico) and fresh fruits ($3.9 billion, 20.1% on average, of total U.S. agricultural imports from Mexico). Together, in 2016 fresh fruits and vegetables from Mexico represented 46.6% ($10.7 billion) of 2016 Mexico’s total agricultural exports to the United States ($23.0 billion). Intermediate agricultural products imported from Mexico by the United States in 2016 reached a value of $2.0 billion with an 8.8% share in 2016 total agricultural imports from that country. Bulk agricultural commodities were 1.2% ($0.3 billion) of total agricultural imports from Mexico by the United States in 2016.
U.S. Exports of Consumer-Oriented Agricultural Products to Mexico
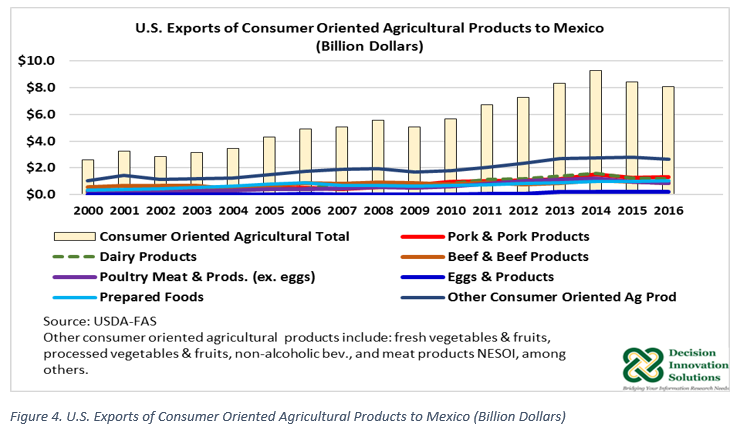
In 2016, U.S. consumer-oriented agricultural product exports to Mexico were down 3.8% to $8.1 billion year over year (see Figure 4). The 2016 value of U.S. consumer-oriented products exported to Mexico represented 45.1% of 2016 U.S. total agricultural exports to that country.
The top U.S. consumer-oriented agricultural products exported to Mexico in 2016 were pork and pork products with a value of $1.3 billion. After Japan, Mexico was second largest value market for U.S. pork and products in 2016. According to the U.S. Meat Export Federation (USMEF), their efforts to boost pork demand in Mexico have contributed to the increase in per capita pork consumption, which has increased about 20% since 2011 and is currently above 40 pounds per year, compared with 64 pounds (carcass weight equivalent), the U.S. per capita pork consumption in 2015. The strong demand of U.S. pork by Mexico is key to the U.S. pork industry during this time of record high U.S. pork production.
Other U.S. consumer-oriented agricultural products exported to Mexico in 2016 were dairy products ($1.2 billion), and prepared foods ($1.0 billion). Pork and pork products, together with these two other groups of commodities made almost a fifth (19.7%) of the value of U.S. agricultural exports to Mexico last year. The value of U.S. beef and beef products and U.S. poultry and poultry products (excluding eggs) exported to Mexico was $0.9 billion each. Among all U.S. consumer oriented products exported to Mexico, only U.S. pork and pork products and U.S. prepared food increased their value by 7.0% and 1.7%, respectively, compared with the previous year. The value of U.S. beef exports to Mexico declined 10.8% year over year; however, as the USMEF indicated, Mexico continues to be an import market for beef products such as beef shoulder clods and rounds, and beef variety meat. Mexico was the third largest market for U.S. beef and beef products in 2016, after Japan, the leading market, and South Korea.
U.S. Exports of Bulk Agricultural Products to Mexico
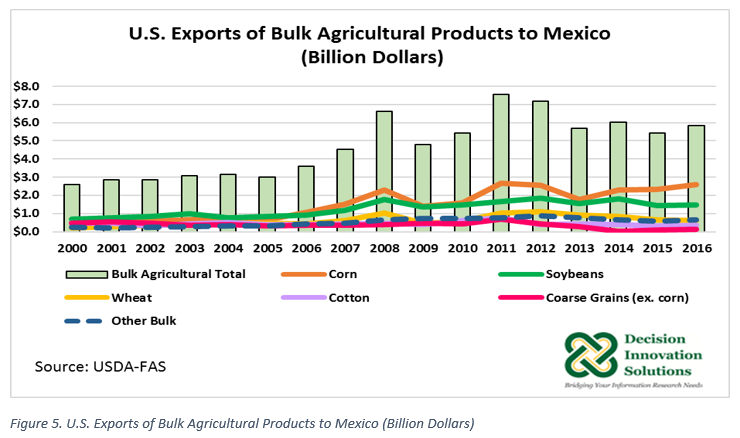
In 2016, U.S. exports of bulk agricultural products to Mexico were up 7.5% to $5.8 billion compared with the previous year (see Figure 5). The share of U.S. bulk agricultural products exported to Mexico relative to total U.S. agricultural products exported to Mexico increased from 30.4% in 2015 to 32.5% in 2016. The value of U.S. corn exports to Mexico was up 11.9% to $2.6 billion. This value represented 44.7% of 2016 U.S. total bulk agricultural exports to Mexico and 14.5% of 2016 U.S. total agricultural exports to Mexico during that period.
From 2000 to 2014 Mexico was the number two market for U.S. corn, with Japan as the number one market. For last two year, however, Mexico has been the main export market for U.S. corn, followed by Japan. In 2016, U.S. corn exports to Mexico represented 26% of U.S. corn export value ($10.0 billion) with Japan representing 21% of the total U.S. corn export value last year. In addition to Mexico and Japan, U.S. corn was exported to another 137 countries, making up the remaining 53% of the total U.S. corn exports in 2016.
The value of U.S. soybean exports to Mexico was up 2.1% to $1.5 billion in 2016, representing 25.1% of the value of U.S. bulk agricultural products exported to that country last year. Mexico is a distant third largest market for U.S. soybeans with 6.4% share of the total value of 2016 U.S. soybean exports ($22.9 billion). Total exports to Mexico trailed China, which had a share of 62.1% (14.2 billion), and the European Union which had an 8.2% share (1.9 billion).
U.S. Exports of Intermediate Agricultural Products to Mexico
The value of 2016 U.S. intermediate agricultural products exported to Mexico increased 1.4% to $4.0 billion year over year, representing 22.4% of 2016 U.S. total agricultural exports to Mexico. The value of U.S. soybean meal exported last year to Mexico ($0.8 billion) remained the same as last year, whereas the values of distillers dried grains with solubles (DDGS) and feeds and fodders (not elsewhere specified or indicated, “NESOI”) rose 3% to $0.4 billion and 6.2% to $0.2 billion, respectively, compared with their corresponding values in 2015.
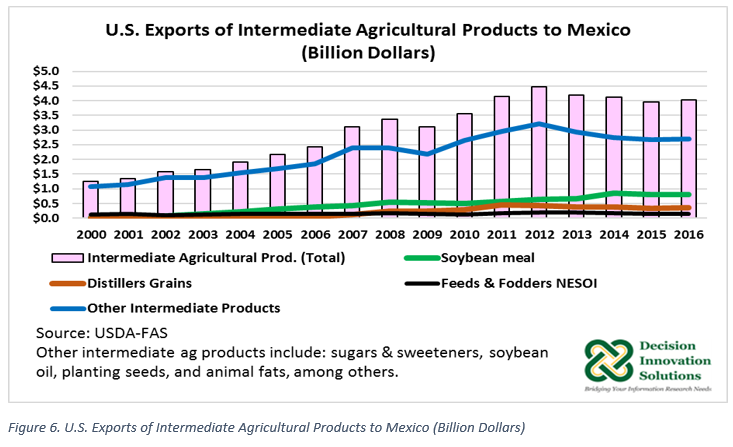
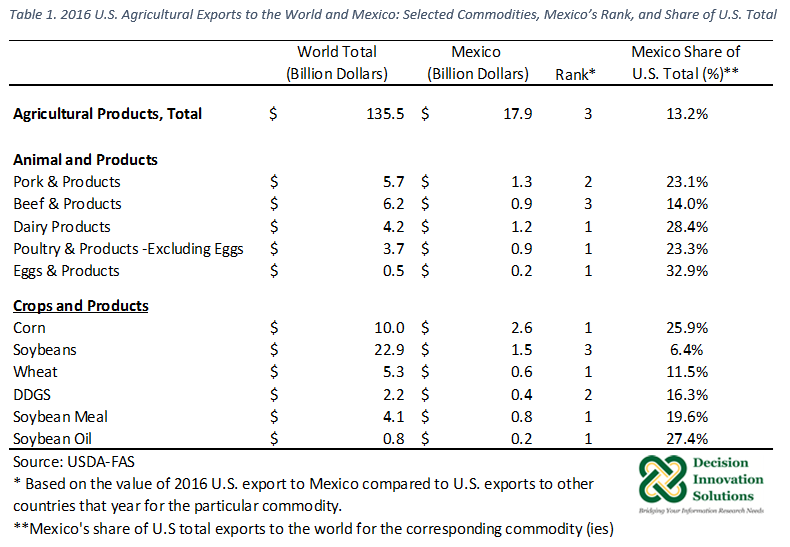
Table 1 shows a summary of U.S. agricultural products exported to the world and Mexico in 2016. Based on the value of the selected U.S. commodities exported to Mexico in 2016 relative to the total value of the U.S. commodities exported to the world, Mexico ranked as number one market for the following U.S. products: corn, wheat, soybean meal, soybean oil, dairy products, poultry and products (excluding eggs), and eggs and products. For commodities such as pork and products and DDGS, Mexico ranked as number two market, whereas for beef and products and soybeans, Mexico was ranked as number 3 market.
Trade between the United States and Mexico has substantially increased since NAFTA was implement in 1994. As the third most important value market for U.S. agricultural products, in general, and as a number one and two market for several agricultural commodities, in particular, it would be hard to overstate the importance of Mexican demand for U.S. agricultural products, particularly during these times of large supplies. The impending renegotiation of NAFTA could bring changes to trade policy which could disrupt trade of important U.S. agriculture-related products and industry with Mexico.

