

By Ruiwen Zhou and Sampath Jayasinghe
The water quality trend is correlated with many factors, such as weather conditions, land use, and government policy. In this article, we examined nitrate concentration levels (mg/l) in the Raccoon River in Iowa from 1980 to 2015. We wanted to find out the trend in nitrate concentration in the river and the factors driving the variation of nitrate concentrations. Recent water quality literature pointed out precipitation, baseflow, and soybean cultivation have a strong influence on nitrate concentration.
First, we converted monthly average nitrate concentrations into flow weighted average nitrate concentration (FWA-N). The use of FWA-N helps to separate the influence of flow from other possible drivers. We noticed that the variation of FWA-N is very large across the time line. The research objective here was to interpret the variation after adjusting for seasonality. FWA-N would change with temperature and precipitation, which are the sources of seasonality and time lags. We used the additive decomposition in the time series model to get the estimation for seasonality and adjust as needed.
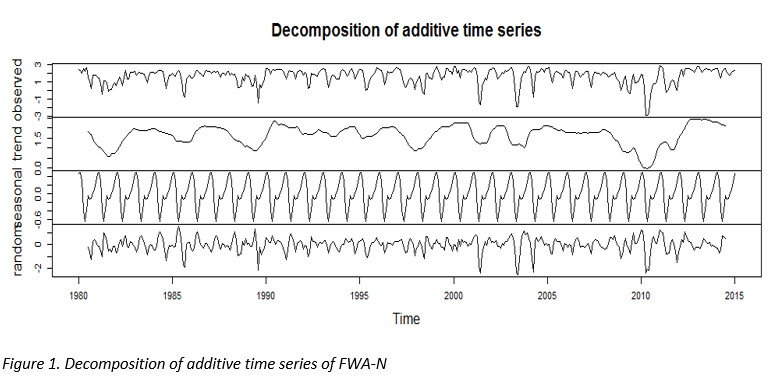
Figure 1 shows the decomposition of FWA-N into three components using the statistical analysis software R. The top panel in Figure 1 shows monthly FWA-N. The second panel in Figure 1 shows the time trend line (nonlinear). The third panel shows the seasonal component in FWA-N. The fourth panel in Figure 1 shows the random component in FWA-N. There is a strong seasonality pattern within the variation of FWA-N.
We used monthly seasonal indexes to adjust FWA-N and to get rid of the seasonal component. Our dependent variable in the time series model is the seasonally-adjusted monthly FWA-N and covariates are average monthly temperature, total monthly precipitation, corn acreage, and soybean acreage. All the covariates (i.e., predictors) in the model were standardized to prevent significant differences in their values. In the regression, we used a general linear regression model (GLM) with a Gaussian link between the dependent variable and the covariates. We ran two different GLM models. Table 1 summaries the estimated parameters from the two different regressions. First, we ran FWA-N with average monthly temperature, total monthly precipitation, and corn acreage (Model 1 in Table 1). Then we ran separately FWA-N with average monthly temperature, total monthly precipitation, and soybean acreage (Model 2 in Table 1).
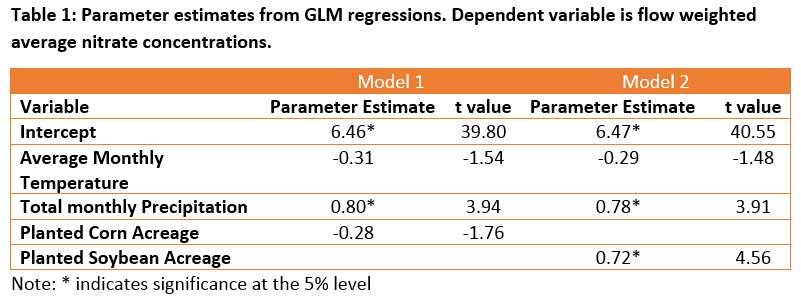
The results show that the soybean acreage and precipitation have a significantly positive influence on FWA-N level, and there is no evidence that corn and average temperature have a significant relationship with FWA-N concentration in the Raccoon River. There are several explanations why FWA-N increases with the soybean acreage in the literature. Microorganisms quickly react to additions of easily decomposed organic matter, such as soybean residue. Decomposing soybean plant matter produces mineralization rates about 1.5 times greater than non-legumes because of its lower Carbon to Nitrogen ratio. Nitrate levels resulting from this process would be vulnerable to leaching in the spring following their harvest.