Worldwide, the per capita consumption of fish is increasing. Some of that increase is due to population growth and some growth is due to rising incomes.
“Since 1961, the average annual increase in global apparent food fish consumption (3.2 percent) has outpaced population growth (1.6 percent) and exceeded consumption of meat from all terrestrial animals, combined (2.8 percent) and individually (bovine, ovine, pig, other), except poultry (4.9 percent). In per capita terms, food fish consumption has grown from 9.0 kg (19.8 lbs.) in 1961 to 20.2 kg (44.5 lbs.) in 2015, at an average rate of 1.5 percent per year. Preliminary estimates for 2016 and 2017 point to further growth to about 20.3 and 20.5 kg respectively (44.8 and 45.2 lbs.).”1 Note: Conversion to lbs. are mine.
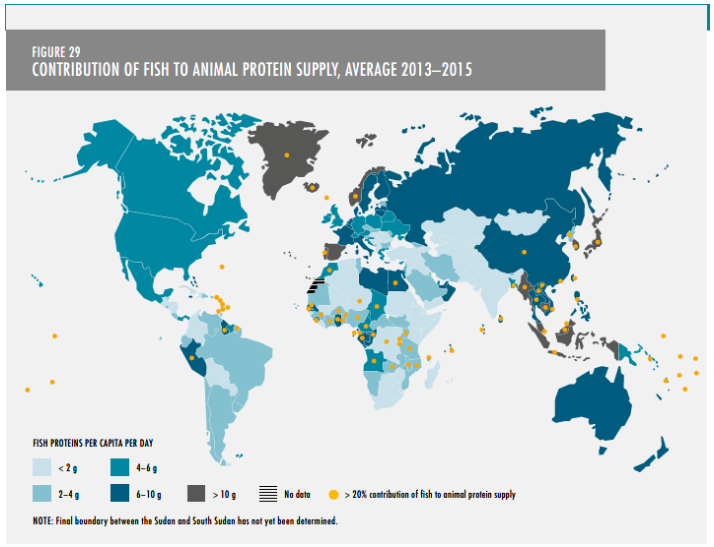
Besides other nutrients, fish is a source of high quality, easily digestible animal proteins. This chart from the FAO 2018 report shows that the average contribution of fish to the total animal protein supply is 4-6 grams per capita per day. That equates to about 1.25 ounces per capita per week.

So, what does this mean to a farmer in Iowa? It means increased potential for domestic and foreign use of crops grown in the US. “Wild fish capture reached its maximum volume cap in the mi-1980’s and cannot grow to meet this demand”. (www.soyaqua.org) That means the increased demand must be met by aquaculture operations.
Most of the fish you and I eat are carnivores. They eat other fish and aquatic animals. There are a few species that are omnivores, but the majority of the fish wild-caught or farm raised are carnivores. This poses an economic and sustainability problem because one of the primary ingredients in most farm raised fish rations is fish meal. Some fish meal comes from the processing of fish, but the majority comes from wild caught fish like anchovies from Chile or Peru. Fish meal is in high demand because it is also used in other animal food including many varieties of cat and dog food as a source of Omega 3’s and other nutrients.
While it is not a new practice, many aquaculture operations are introducing soybean meal as partial replacement for fish meal. Soybean meal is less expensive and is a high-quality source of protein. Decision Innovation Solutions (DIS) has worked on several projects that included producing estimates of soybean meal and other feed ingredient consumption by species. The amount of soybean meal as a percent of the total ration varies from 15% for some carnivores to 40% for some omnivores.
Some of the food fish raised in the U.S. are shown in table 1 below. In some cases, the range begins at 0%. That is because of the different types of production systems will determine the amount of soybean meal included in the ration. For instance, some pond raised shrimp and prawns live off the pond environment with little or no supplemental feed. Shrimp raised in Recirculating Aquaculture Systems (RAS) may have up to 25% soybean meal in their feed rations.
Table 1 Soybean Meal Inclusion Rates in Food Fish 
In one of our recent studies DIS estimated the soybean meal consumed by Catfish and Trout raised in the U.S in 2017 was over 164,000 tons. That equates to about 6.5 million bushels of soybeans just for those two species. Research is ongoing in developing strains of these species and others that can tolerate higher inclusion rates. For instance, studies are underway in Mexico to replace sardines in the diet of bluefin tuna.
We have also seen aquaculture operations spring up in the Midwest. Besides soybean meal, other agriculture products like Dried Distillers Grains (DDGS) are important ingredients in fish feed formulas. They are bringing the fish to the feed. So, the fish you eat may be meat eaters but, if they are farm raised, they probably ate their vegetables too. And that is important to farmers.
1 FAO. 2018. The State of World Fisheries and Aquaculture 2018 – Meeting the sustainable development goals. Rome. Licence: CC BY-NC-SA 3.0 IGO.

