IMPLAN recently released their newest dataset. Constructed using 2021 data, this dataset represents the most current economic data available at this level of detail. As the U.S. economy recovers from the effects of the Covid-19 pandemic, there are some significant changes to the IMPLAN data relative to previous years, particularly when compared to the 2020 data.
The economy as a whole grew significantly between 2020 and 2021, and this is reflected in the IMPLAN data. In nominal terms, value added (equivalent to GDP) increased by $2.42 trillion, while personal income increased by $1.67 trillion. In addition, overall employment increased by 1.37 million[1].
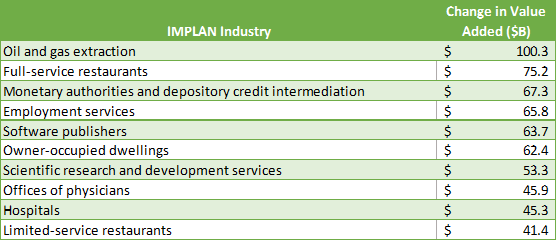
Of course, this growth was not spread evenly throughout the economy. Table 1 shows the top ten IMPLAN industries according to their growth in value added between 2020 and 2021. Oil and gas extraction grew by more than $100 billion during this period, the most of any IMPLAN industry. Full-service and limited-service restaurants grew by $75.2 and $41.4 billion respectively for a combined growth of $116.6 billion. Other areas of the economy that experienced large amounts of growth include banking, employment services, software publishing, homeownership[2], and healthcare.
Table 1. Top Ten Industries by Growth in Value Added

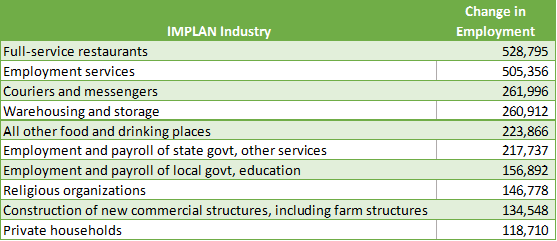
Table 2 shows IMPLAN industries by their growth in employment between 2020 and 2021. Some industries show large growth in employment as well as value added, such as full-service restaurants and employment services. However, many industries experienced significant growth in employment without breaking into the top ten in terms of value added, such as couriers and messengers, warehousing and storage, and construction of commercial structures.
Table 2. Top Ten Industries by Growth in Employment

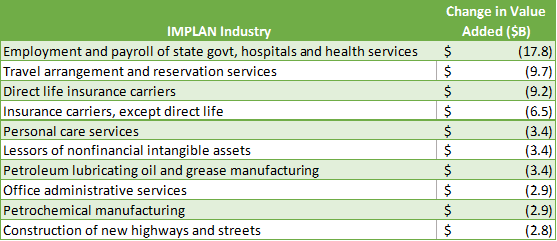
Though most areas of the economy grew between 2020 and 2021, a few did not. Table 3 shows the IMPLAN industries that lost the most in terms of value added. The industry with the largest loss of value added is employment and payroll of state government hospitals and health services, though it should be noted that the loss in this sector is more than offset by the growth of the healthcare industries in Table 1. Other areas with large losses include travel, insurance, administrative services, and industries related to petroleum manufacturing.
Table 3. Top Ten Industries by Loss in Value Added

Many of the high-growth sectors of the economy are indicative of either 1) the nation’s response to the pandemic (such as the healthcare- and delivery-related industries) or 2) sectors rebounding from losses caused by the initial shutdowns in 2020 (such as the construction and food service industries). Likewise, many of the industries with losses can trace those losses to lingering effects of the pandemic, particularly the insurance and travel sectors. Overall, the latest IMPLAN dataset gives us valuable insight into the economy’s “new normal” and provides us with an updated foundation from which we can conduct meaningful and relevant economic impact and contribution analyses.
[1] Employment in IMPLAN is defined and calculated differently than other common employment statistics. For example, IMPLAN employment includes farm jobs and counts all jobs equally regardless of their full-time equivalence.
[2] The “owner-occupied dwellings” industry in IMPLAN represents the economic activity associated with homeownership. This primarily includes home maintenance and improvement, mortgage interest payments, and payment of property taxes. Growth in this industry indicates a rising homeownership and/or rising home values.

