The U.S. Department of Agriculture Economic Research Service publishes the Food Access Research Atlas, which is a dataset measuring areas of the U.S. that have difficulty with reliable access to food through grocery stores or supermarkets. This dataset measures food access at a highly granular level using several different indicators.
The map below shows U.S. census tracts that are indicated as both low income and having low access to food, otherwise known as a food desert. Low-income tracts are those that have a poverty rate of 20 percent or more or have a median family income of less than 80 percent than that of the surrounding area (either state or metropolitan area). Low access tracts are those that have at least 500 people in or 33 percent of a census tract who live more than 1 mile from the nearest supermarket in an urban area or more than 10 miles from the nearest supermarket in a rural area[1].
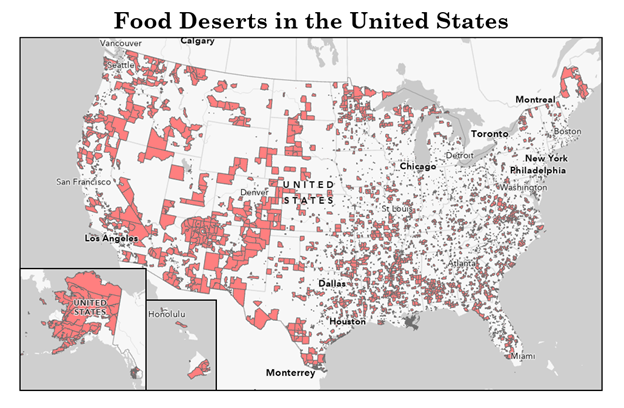
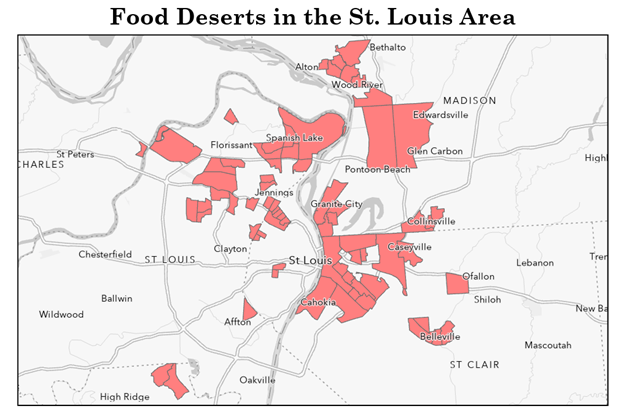
While the country-scale map predominantly shows food deserts that are present in the larger, more rural census tracts, many of the smaller, more urban census tracts are also food deserts. For example, the below map shows census tracts that are indicated as food deserts in the St. Louis metropolitan area.
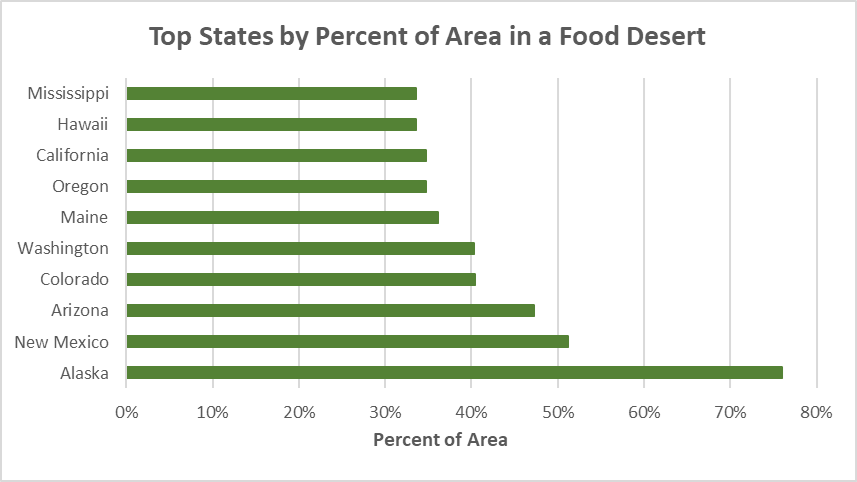
The prevalence of food deserts varies significantly by state. Alaska has the highest relative share of land area that is classified as a food desert due to much of the state being unpopulated or lowly populated. Many western states such as New Mexico, Colorado, and Washington are among the states with the highest share of area in a food desert.
However, a largely different set of states are at the top when it comes to the relative population living in a food desert[1]. Here, many southern states such as Mississippi, Louisiana, Georgia, and Alabama are present. Notably, New Mexico is one of the most affected states by both measures. The states with the lowest portion of their population living in a food desert are New York with 3.9% and New Jersey with 5.2%.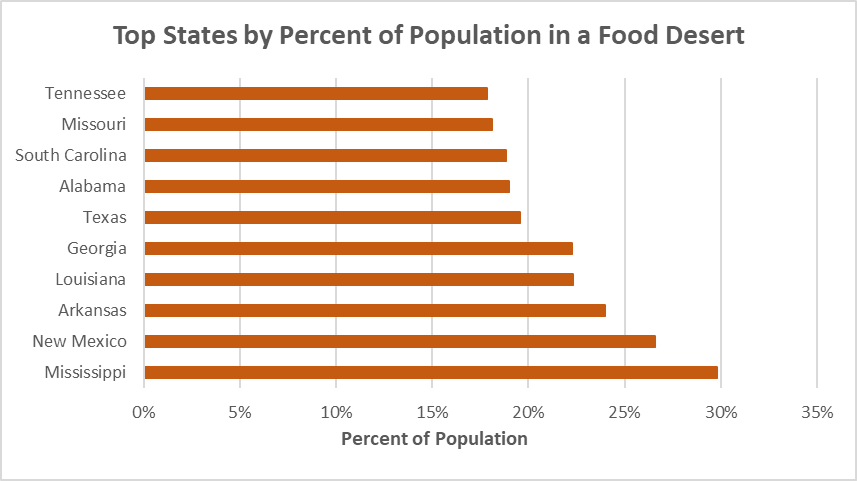
Core based statistical areas (CBSAs) are statistical areas capturing a city and its surrounding suburbs and exurbs, with boundaries typically defined at the county level. The below map shows CBSAs with a population of more than 1 million. These areas were used for the calculation of city-level food desert statistics.
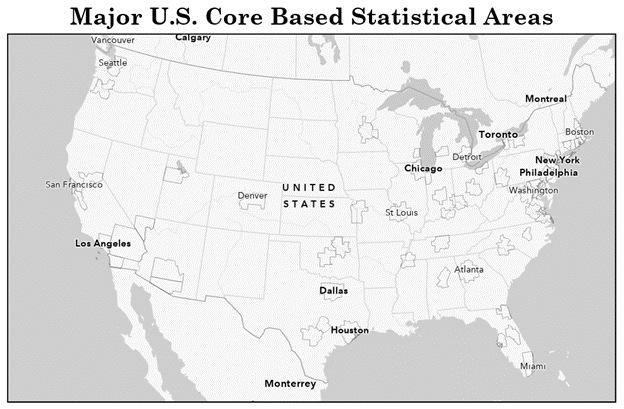
Core based statistical areas (CBSAs) are statistical areas capturing a city and its surrounding suburbs and exurbs, with boundaries typically defined at the county level. The below map shows CBSAs with a population of more than 1 million. These areas were used for the calculation of city-level food desert statistics.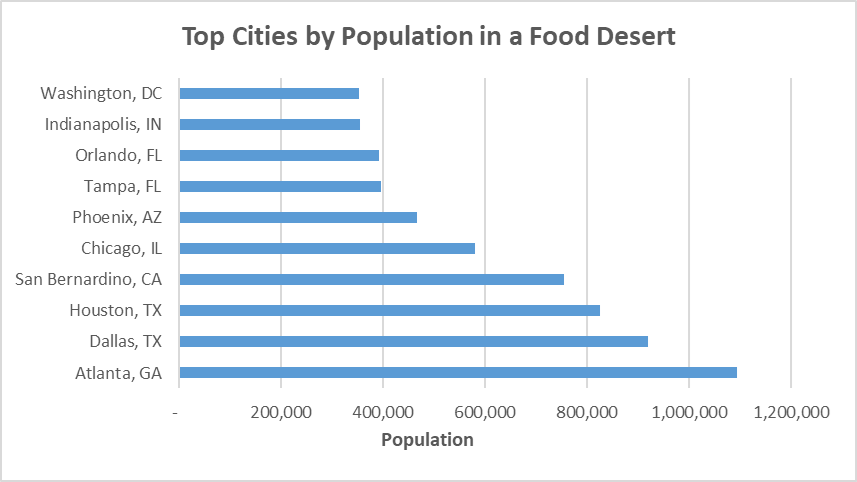
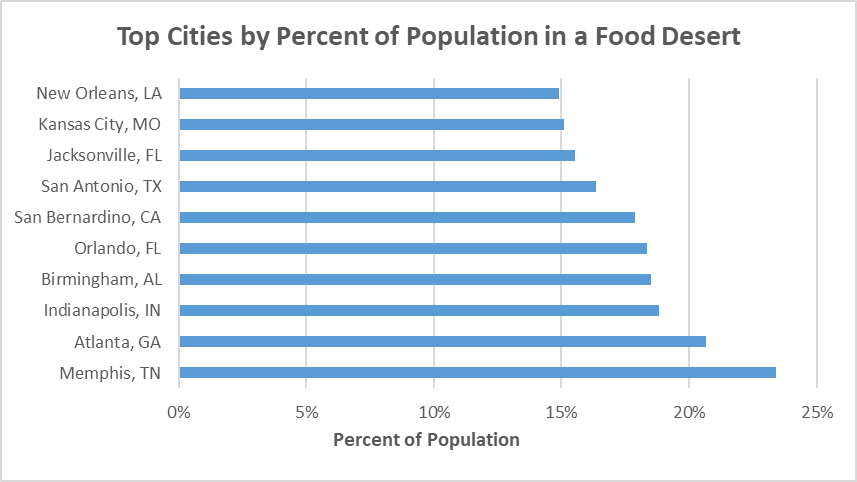
Memphis is the most affected city by the percentage of population living in a food desert. Atlanta, San Bernardino, Orlando, and Indianapolis are in the top ten cities by both measures, indicating that these cities may suffer a particularly severe problem with reliable access to food.
Overall, there is significant regional variation in the presence of food deserts throughout the United States. While some cities and states appear to have few problems with reliable access to food, it remains a serious issue for many others.
References
- Economic Research Service (ERS), U.S. Department of Agriculture (USDA). Food Access Research Atlas
- U.S. Census Bureau, Esri. Age and Gender Demographics in the 2010 Census,
- U.S. Census Bureau, Esri. USA Core Based Statistical Areas,
[1] This is just one measure of low income and low access; several others are present in the Food Access Research Atlas dataset.
[2] Note that as the 2019 Food Access Research Atlas is based on 2010 census tracts, the relative population shares shown reflect 2010 census data.

