

Looking at the Latest IMPLAN Data
By Kade Grafel, Research Analyst, Decision Innovation Solutions
The latest IMPLAN dataset, based on 2023 data, was released at the tail end of 2024. Thanks to several updates to the data used to build IMPLAN’s models, this year’s data is much more than just an annual refresh. The 2023 dataset may be one of the most impactful upgrades to economic input-output modeling in recent years.
Updated BEA Benchmark Input-Output tables are the most significant change in this year’s IMPLAN data. These tables are only released once every 5 years by the Bureau of Economic Analysis, and they provide much of the foundational relationships between industries that form the basis of IMPLAN’s input-output models. The BEA Benchmark tables are the primary source of IMPLAN’s industry spending patterns, which dictate the rates at which industries purchase goods and services from each other.
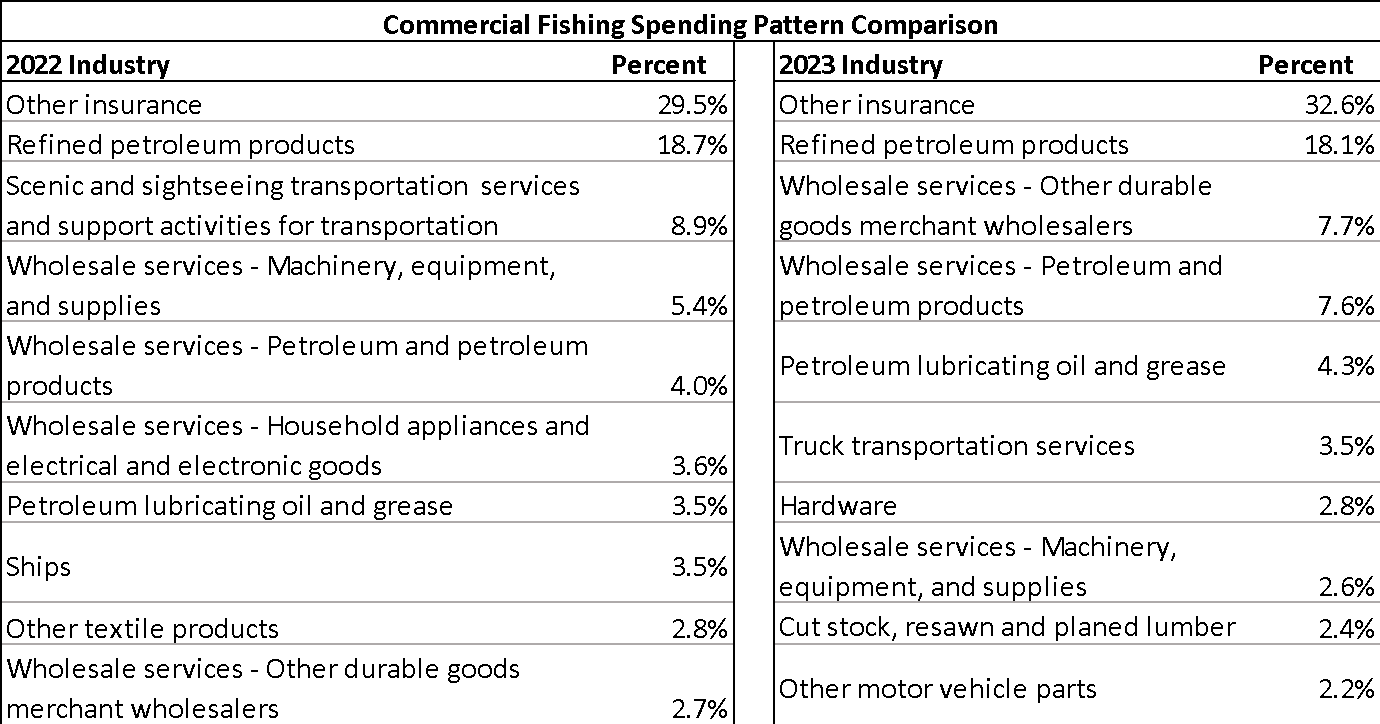
For example, the table below shows the top commodities demanded by the commercial fishing industry in last year’s IMPLAN data (which used the old BEA Benchmark tables) compared to this year’s data. While “other insurance” and “refined petroleum products” occupy the top two commodities in both years, there are some substantial differences.
Ships were around 3% of the industry’s total expenditures in 2022 but dropped out of the top 10 commodities in 2023. Other motor vehicle parts are new to the top 10 in 2023, suggesting that commercial fishers may be purchasing fewer new ships in 2023 and are opting to spend more on repairing their current fleet. Additionally, many wholesale services differ between the two years—though this may be due to businesses changing which NAICS code they identify as their primary activity.
The new IMPLAN data has a reduced set of 528 industries as opposed to the 546 used over the past 5 years. Some industries have been merged or absorbed into a more general industry because of a lack of data from the BEA.
For example, “gold ore mining” and “silver ore mining” have been combined into one industry, and “printing machinery and equipment manufacturing” has been absorbed into “all other industrial machinery manufacturing.”1
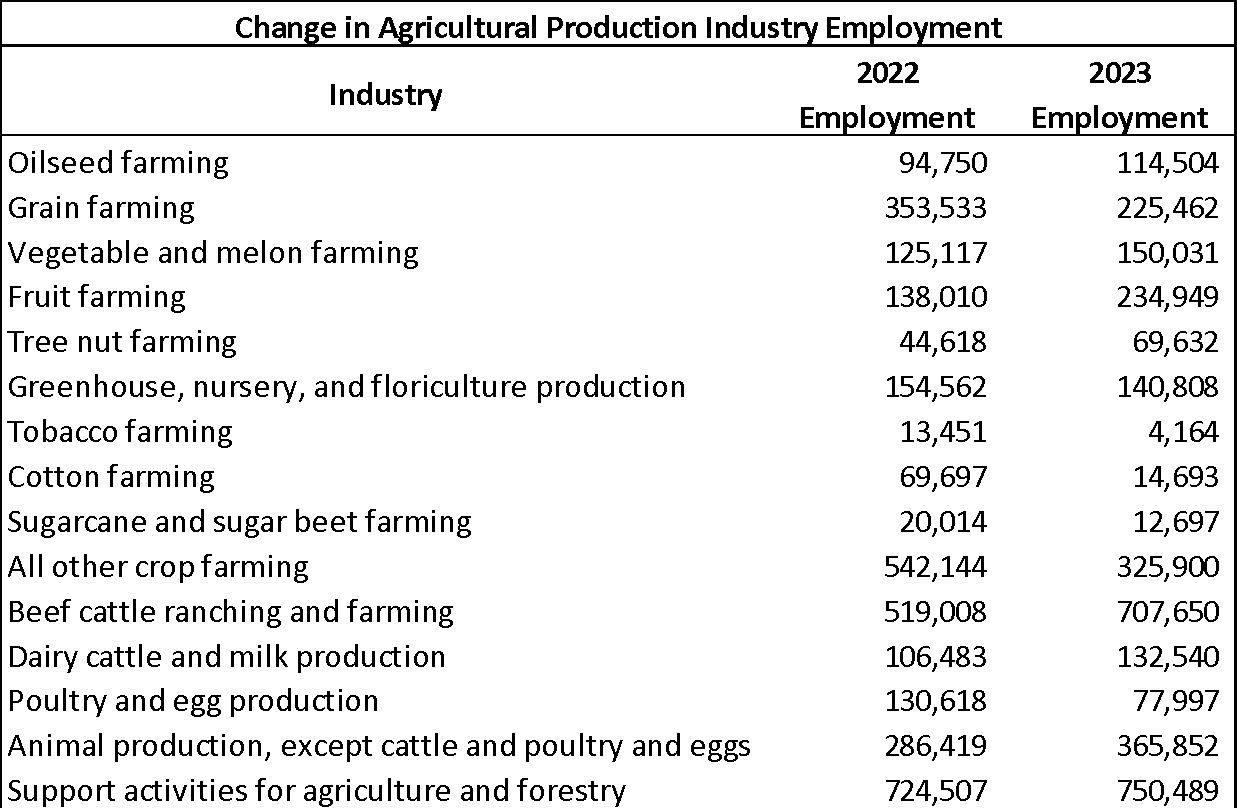
The 2023 IMPLAN data is also the first to incorporate the 2022 USDA Census of Agriculture. Combined with a change in IMPLAN’s methodology for estimating employment for each farm industry, this has resulted in significant changes to the relative employment of the agricultural production industries.
The total employment among the industries shown in the table below has increased very slightly, from 3.32 million to 3.33 million. However, some industries have seen significant changes, such as beef cattle ranching and farming employment increasing by nearly 200,000, along with significant decreases in the employment of tobacco, cotton, sugarcane, and sugar beet farming industries.
Similar changes have likely occurred at the county level, as the USDA Census of Agriculture is the primary (and in many cases the only) source of agricultural data for individual counties.
The 2023 IMPLAN data is a major update incorporating two data sources that only get updated once every 5 years: the BEA Benchmark tables and the USDA Census of Agriculture. The economy is always changing, so these significant updates are critical to ensure that we at DIS are able to provide the most meaningful and accurate economic impact and contribution analysis to our clients.
- A full list of the combined industries is available at: https://support.implan.com/hc/en-us/articles/31304600127899-2023-U-S-Data-Release-Notes ↩︎