

By David Miller, Consulting Chief Economist, Decision Innovation Solutions
The Carbon Intensity (CI) Score for Iowa corn has seen dramatic reductions since the 1970s. Combinations of increased yields, greater fuel efficiency, and greater fertilizer efficiency have all contributed towards reductions in the CI score of corn from the input side. For the past 10 years, the Feedstock CI score of corn with no adjustment for Soil Organic Carbon (SOC) has been between 23 and 26. In the latest year with data (2023), the CI score of corn, unadjusted for SOC, was 23.11. Compared to the peak in 1977, the CI score of Iowa corn in 2023 has declined by 53.3%
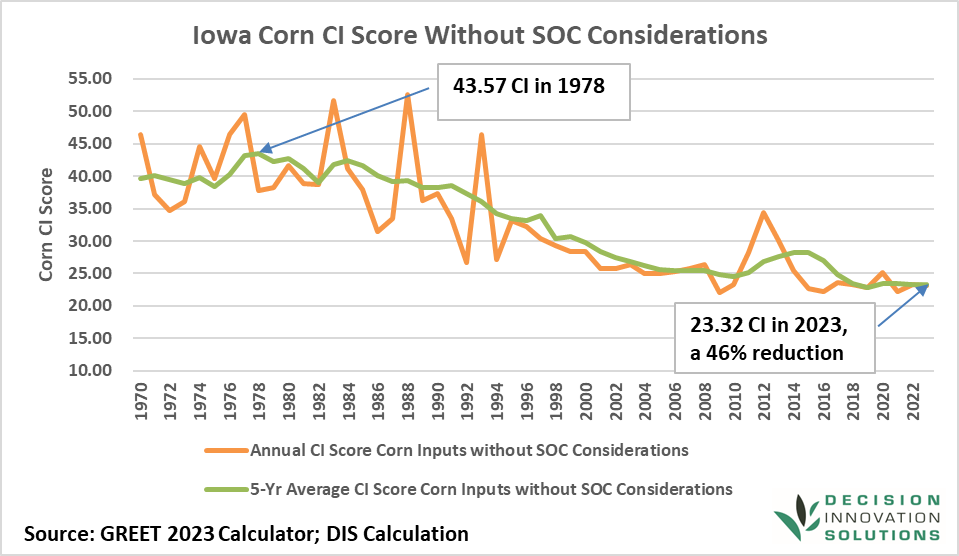
Due to year-to-year weather variations, rolling averages are one way to view longer-term trends in CI scores of corn. The 5-year rolling average of Iowa’s CI Score for corn with no adjustment for SOC peaked in 1978 at 43.57 CI points. In 2023, the 5-year average was at 23.32. The 5-year average is down 46% since the 1978 peak.
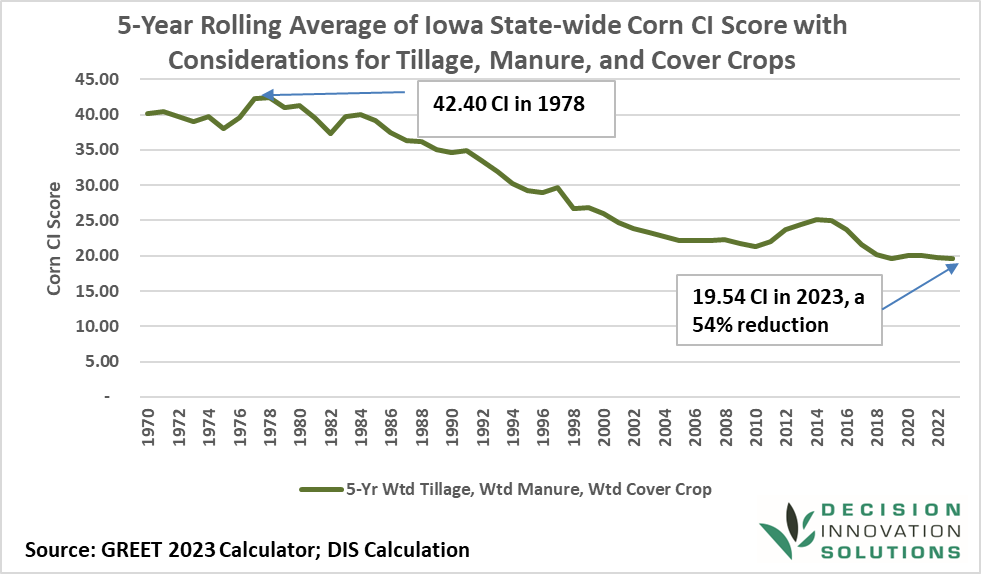
Adding changes in SOC into the CI scores creates a more complete picture of the improvements that farmers have made in lowering the CI scores of corn production. The adoption of tillage practices (reduced-tillage and no-till) contributes to less carbon emissions from the soil due to soil disturbance and greater sequestration of carbon in soil organic matter. Manure applications also reduce the CI score of corn by replacing applied commercial fertilizers.
Additionally, the use of cover crops contributes to lowered CI scores in corn. When adding in the “bottom half” of the GREET model (adjustments for tillage, manure, and cover crops), the 5-year rolling average CI score is down nearly 54% from the peak in 1978. This is reflective of what has happened to Iowa corn production in the aggregate over the past 45+ years. Individual farmers have achieved greater or lesser changes than this depending on their individual yields, production inputs, and production technologies utilized.
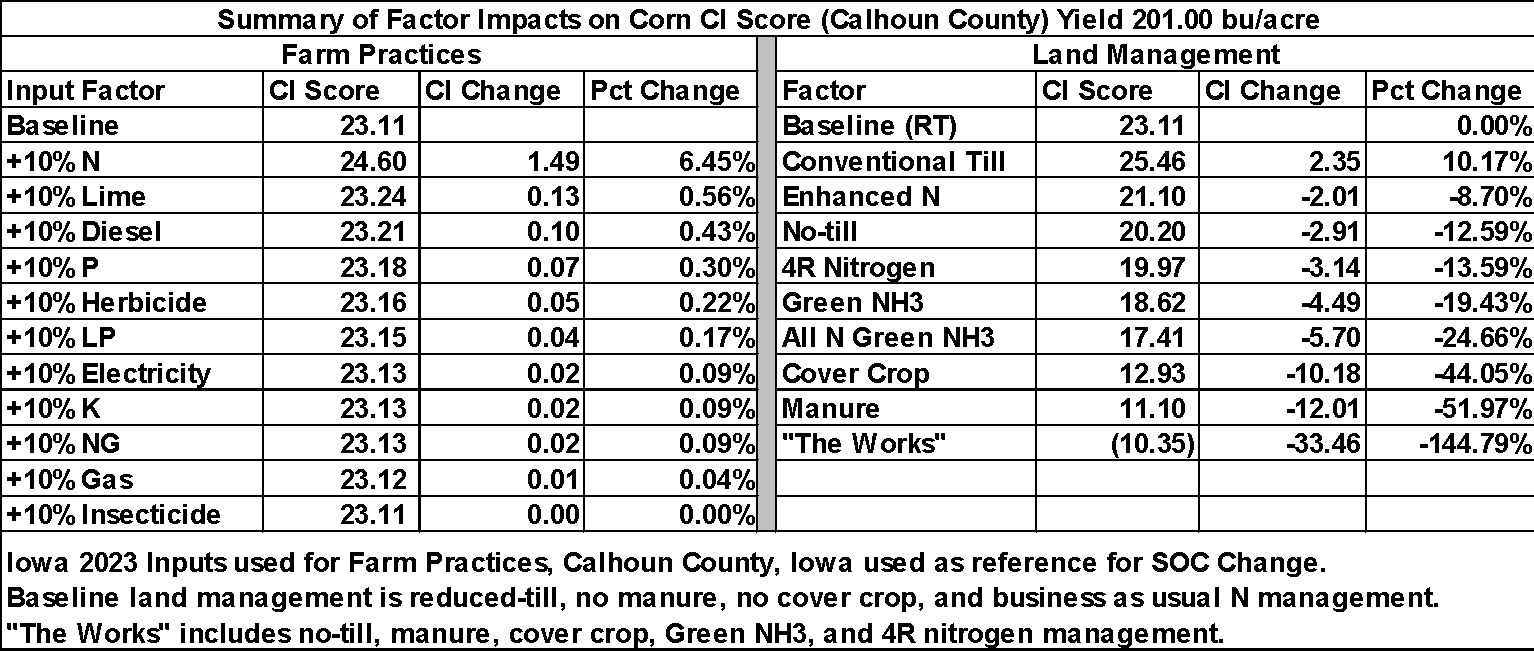
For farmers who do not have access to manure, the use of no-till and cover crops are two of the most effective ways to reduce the CI score of corn production. The table below shows the relative changes in CI scores from changes in input factors compared to Iowa’s state average in 2023 and the changes in CI scores from production and land management options that producers might select. The use of no-till rather than reduced-till (which is the baseline for CI score calculations) reduces the CI score by slightly more than 12.5%.
The use of cover crops reduces the CI score by 44%, and the use of the 4R Nitrogen management techniques can reduce the CI score by 13.6%. Application of “the works” (no-till, cover crops, manure, green NH3, and 4R nitrogen management) can reduce the CI score by more than 144%.
What is a CI Score?
Every fuel is scored based on the amount of carbon dioxide (CO2) or greenhouse gas (GHG) emissions associated with a megajoule (MJ) of energy. A megajoule is a unit of work or energy equal to 1 million joules and is equivalent to the energy needed to light a 100-watt light bulb for about three hours. A fuel’s carbon intensity (CI) score accounts for every aspect of producing, distributing, and consuming the fuel. For corn farmers, carbon intensity is the energy production footprint assigned to producing the crop. The score is generated using the federally approved Greenhouse Gases, Regulated Emissions, and Energy in Technologies (GREET) model and its associated tool known as the Feedstock Carbon Intensity Calculator (FD-CIC). The FD-CIC takes into account production inputs (fuel, fertilizer, lime, chemicals) as well as production technologies (tillage, manure, cover crops) and calculates the grams of Greenhouse Gas (GHG) emissions per acre, divides that by the crop yield in bushels, and then divides the total grams of GHG per bushel by 232.11 to calculate the CI score per bushel.
What Has Happened to the Major Factors Affecting CI Scores for Corn?
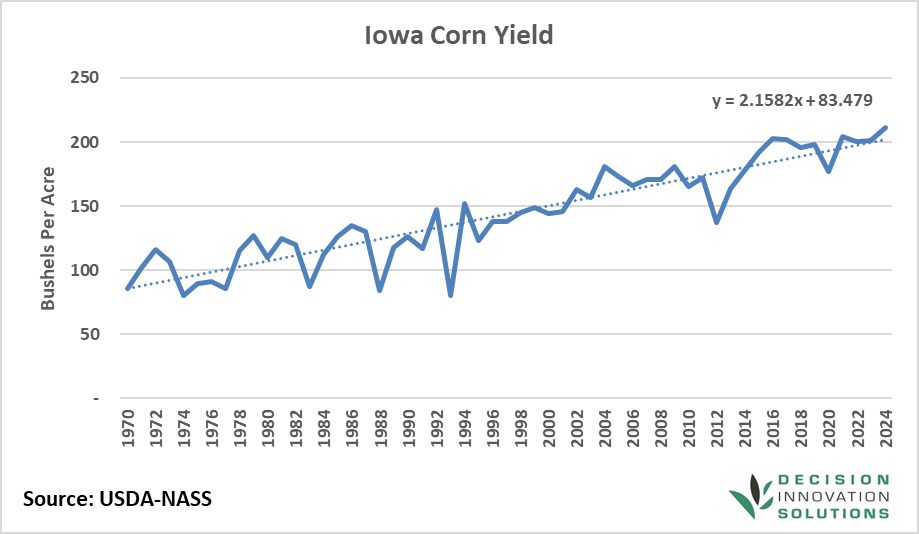
Iowa corn yields have been steadily increasing since 1970. In 1970, Iowa’s corn yield was 86 bushels per acre. In 2024, Iowa’s corn yield reached a new record of 211 bushels per acre. The trend on Iowa’s corn yield is increasing at 2.158 bushels per acre per year since 1970, and there is no evidence that the yield trend is topping out. Increasing yields are one of the most significant factors in why the CI score of Iowa corn is decreasing.
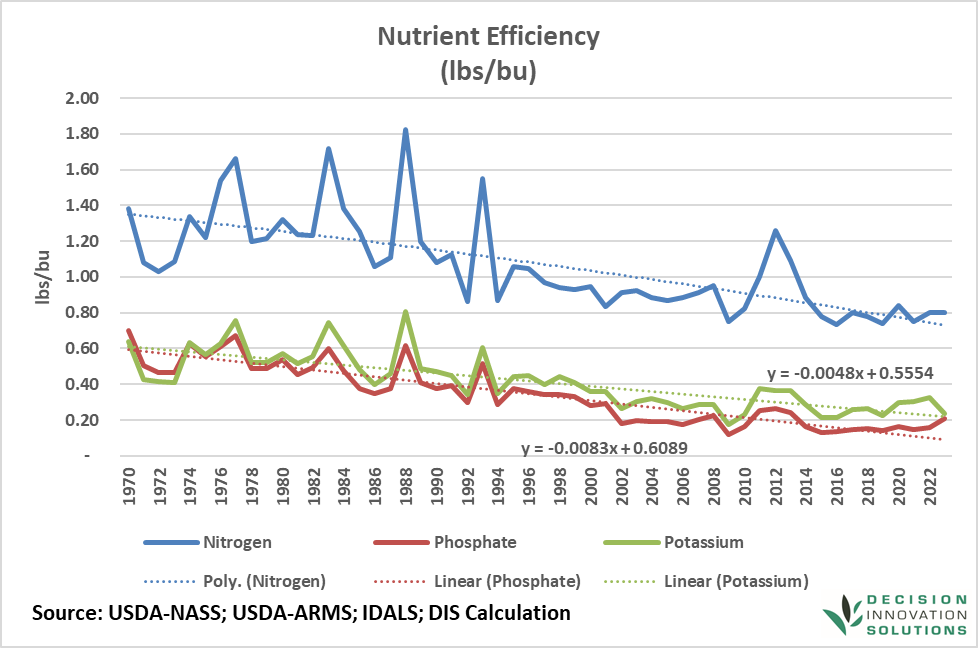
A second factor is nutrient efficiency. Iowa’s farmers are getting more and more yield from the fertilizer applied. Nitrogen per bushel of production has dropped from 1.4 lbs per bushel in 1970 to just over 0.8 lbs per bushel in 2023. Similar declines have been seen for applied phosphate and potassium fertilizers.
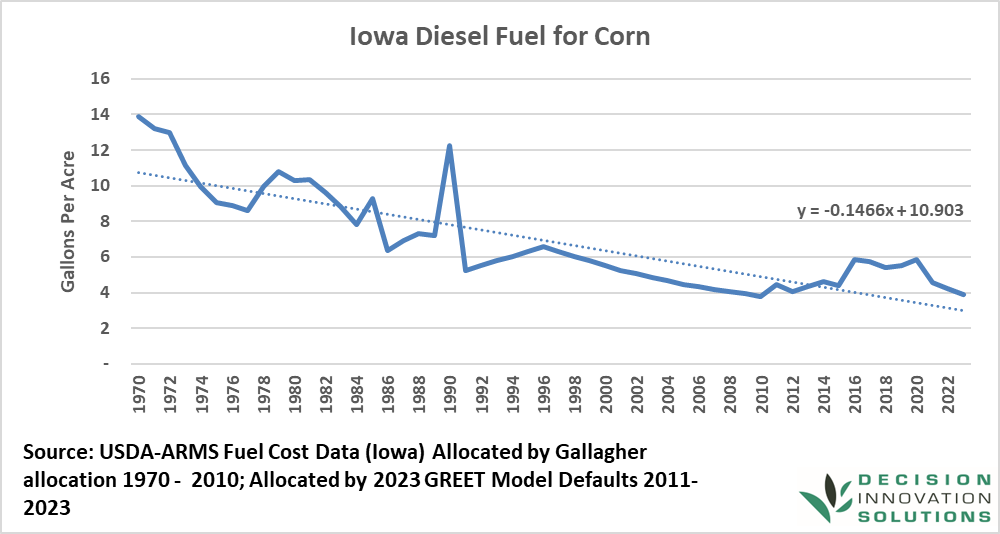
Diesel fuel use per acre of corn is declining. In 1970, it took 14 gallons of diesel fuel per acre of corn production and harvest. Now, it takes about 4 gallons per acre. Larger and faster equipment, combined with less tillage operations, is reducing the amount of diesel fuel per acre of corn, and yield increases are dramatically reducing the amount of diesel fuel used per bushel of corn production.
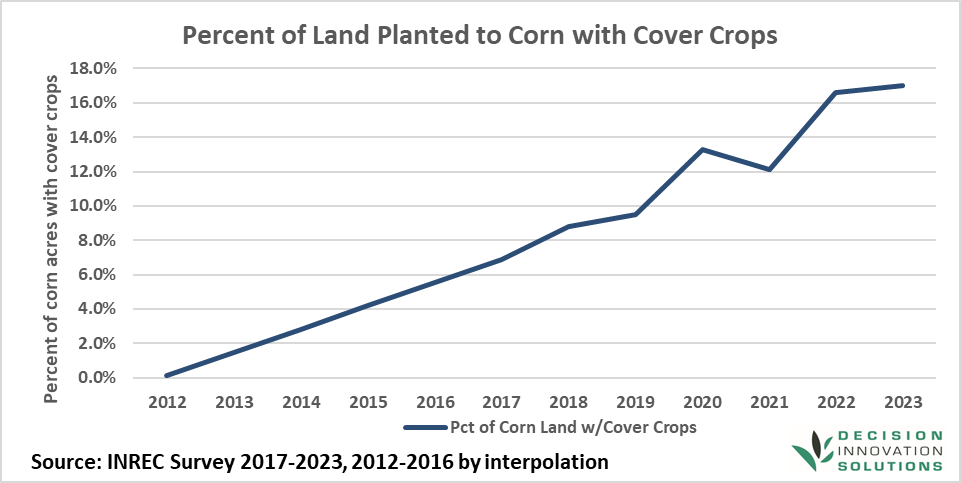
Another factor contributing to reduced CI scores for Iowa corn is the increased use of cover crops. Based on data from the Iowa Nutrient Research and Education Council, cover crops on corn land have risen from near zero in 2012 to more than 16% of land in 2023. The trend is solidly moving higher.
These factors, along with other factors that show improvements with respect to carbon intensity of corn production, are resulting in significant reductions in the CI score of Iowa corn. More improvements are likely to be seen in the future, and if the incentives that could be unleashed by full implementation of the 45Z tax credits for renewable fuels are enabled for renewable fuel feedstocks, the next decade could see the declines in the CI scores of Iowa corn accelerate. It is nothing short of remarkable what Iowa farmers have accomplished in lowering the carbon footprint of corn production.