

In this month’s report, we look at the ethanol crush spread. Ethanol crush spread is a dollar value calculated as the difference between the combined sales values of ethanol, distillers dried grains with solubles (DDGS) and corn distillers oil (CDO) and the cost of corn in producing ethanol. This also is commonly known as the gross production margin (GPM). Previous updates covering GPM can be found in the March 2018 Report from the AgMRC Renewable Energy Report. This GPM analysis represents a real plant situation and demonstrates the importance of the ethanol co-product market on the ethanol plant profitability.
Ethanol producers often use this spread to hedge the purchase price of corn and sales prices of ethanol and DDGS. The spread relationship between corn, ethanol, and DDGS varies over time and offers many opportunities for speculative actions. This GPM calculation is not intended to show precise ethanol plant margins.
Table 1: Weekly Average Iowa Ethanol and Co-Products Processing Values and Indicators of Average Gross Production Margin; February 2017 – February 2019.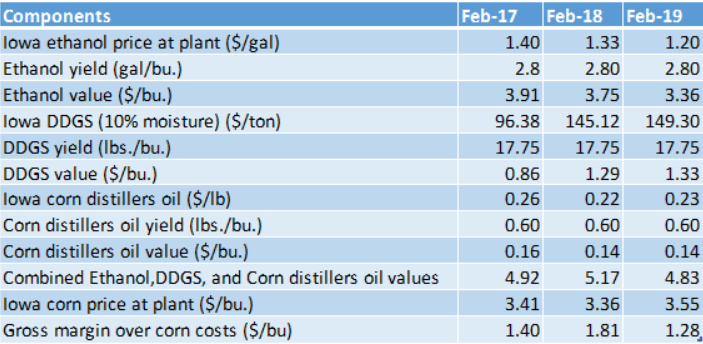
Source: USDA-AMS
Table 1 presents a simple comparison of Iowa average gross production margins in February from 2017 to 2019. Iowa’s corn prices are compared with the value of processing products for Iowa ethanol plants published by the USDA’s Agricultural Marketing Service (USDA-AMS). USDA-AMS publishes weekly cash bid prices of corn, ethanol, and DDGS in Iowa locations. The dry-mill ethanol plants’ gross margins are calculated assuming ethanol yield of 2.80 gallons per bushel, 17.75 pounds of DDGS per bushel, and 0.6 pounds of CDO per bushel.
The Iowa average gross production margin was at $1.28 per bushel of corn in February 2019, compared to $1.81 in February 2018. Ethanol value per bushel has decreased to $3.36 in February 2019 from $3.75 in February 2018. But DDGS value per bushel has increased to $1.23 in February 2019 from $1.29 in February 2018. CDO value per bushel has not changed at $0.14 for the same periods. Combined total ethanol, DDGS, and CDO values have decreased to $4.83 in February 2019, compared to $5.17 in February 2018.
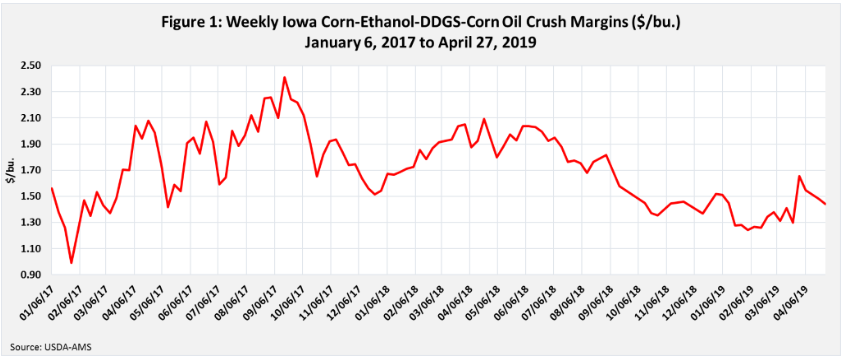
Figure 1 shows estimated weekly Iowa ethanol gross production margins from January 6, 2017, to April 27, 2019. Ethanol gross production margins generally are lowest in the February-March period, rising throughout the year.
The average ethanol price in Iowa dropped to $1.20 per gallon in February 2019, compared to $1.33 per gallon in February 2018. However, the average DDGS price in Iowa rose slightly to $149.30 per ton in February 2019, compared to $145.12 per ton in February 2018. The average CDO price in Iowa rose to $0.23 per pound in February 2019 from $$0.22 per pound in February 2018. The average cash corn price in Iowa also increased to $3.55 per bushel in February 2019, from $3.36 per bushel in February 2018. Overall, average GPM in Iowa decreased by nearly 29 percent in February 2019 from February 2018. The weekly average Iowa GPM in 2017 was $1.77 per bushel of corn, and in 2018 it was $1.78 per bushel of corn. So far in 2019, the weekly average Iowa GPM stands $1.38 per bushel of corn.
As seen in Figure 1, Iowa GPM declines substantially in the third and fourth quarter of 2018 and continued to decline till April 2019. The average ethanol price in Iowa recorded a very low level in December 2018 and January 2019 at $1.17 per gallon.