

In the past three months, we have been through a unique and difficult situation due to the COVID-19 virus. Because of the pandemic, the demand for gasoline dropped dramatically, which reached the lowest demand within a couple of decades. This led to the demand for ethanol decreasing significantly. We analyzed and updated this series article that was previously done in the summer of 2019, which talked about how the Iowa ethanol gross production margin (GPM) behaved (the first blog and second blog are linked here). In this article, we are focusing on the behavior of GPM in the first half-year of 2020.
The gross production margin, in the ethanol industry, commonly represents the difference between the combined sales values of ethanol, distiller’s dried grains (DDGS), and distillers corn oil (DCO), and the price of corn. All data came from Iowa Ethanol Corn and Co-Products Processing Values Report and National Daily Ethanol Report from the USDA AMS website. The latest data was updated on June 26, 2020. Our GPM calculation shows the calculated relationship between the values of ethanol and ethanol co-products and the cost of corn in ethanol production.
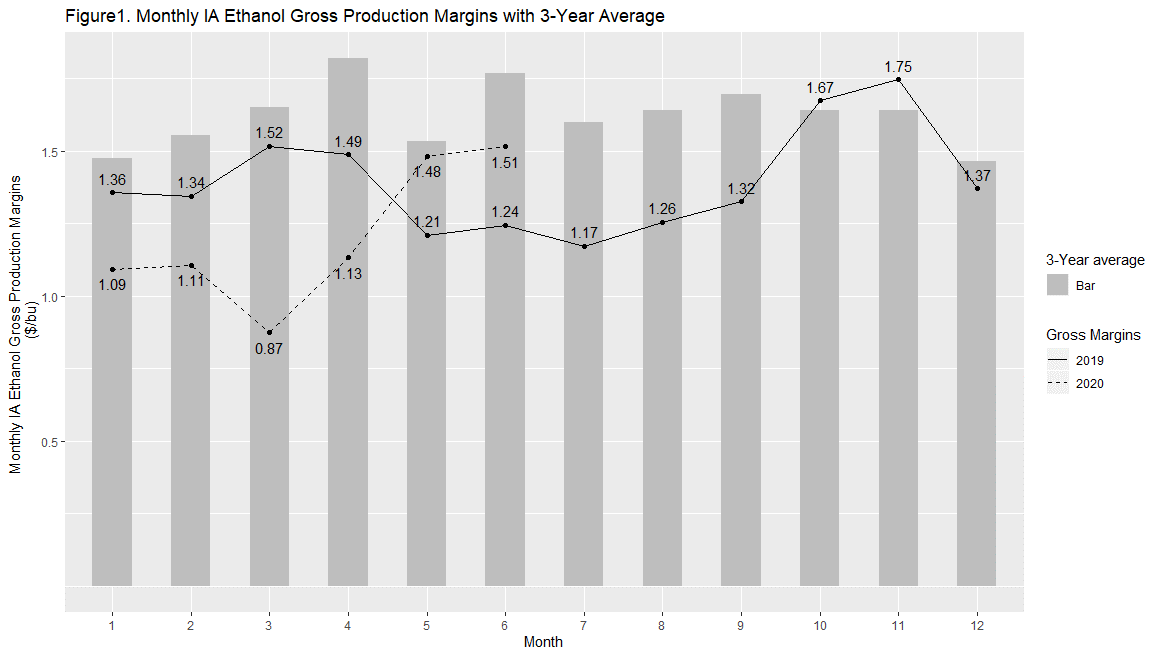
Figure 1 shows the monthly average Iowa ethanol GPM of the year 2019 and 2020, in a solid line and dashed line, respectively. Also, it shows the three-year average (2017 to 2019) Iowa ethanol GPM for each month. Since January 2019, the monthly GPMs have been below three-year average values, except two data points in October 2019 and November 2019. The GPMs in January 2020 and February 2020 were $1.09 per bushel and $1.11 per bushel lower respectively than the 3-year average GPM, which could be because of relatively high corn prices, compared to the same time in the past three years. The GPMs in March and April 2020 were $0.87 per bushel and $1.13 per bushel, respectively, much lower than the 3-year average number. The March 2020 data showed the lowest GPM since 2016. The main reason for that low GPM is due to significantly lower ethanol demand and thus, the significantly low ethanol price. Then the GPMs in May and June went back to the 3-year average level along with ethanol price returned to normal.
The GPM was $0.87 per bushel of corn in March 2020, compared to $1.52 a year ago. The values of ethanol, DDGS, and DCO in March 2020 were $2.87, $1.33, and $0.16 per bushel of corn, respectively. These co-products’ values in March 2019 were $3.71, $1.22, and $0.14, respectively. The ethanol value is significantly lower in 2020 than in 2019. And the ethanol value decreased about 30% from March 2019 to March 2020. Moreover, the GPM was $1.13 per bushel of corn in March 2020, compared to $1.49 a year ago, with ethanol value in April 2020 being $2.16, compared to $3.60 a year prior.
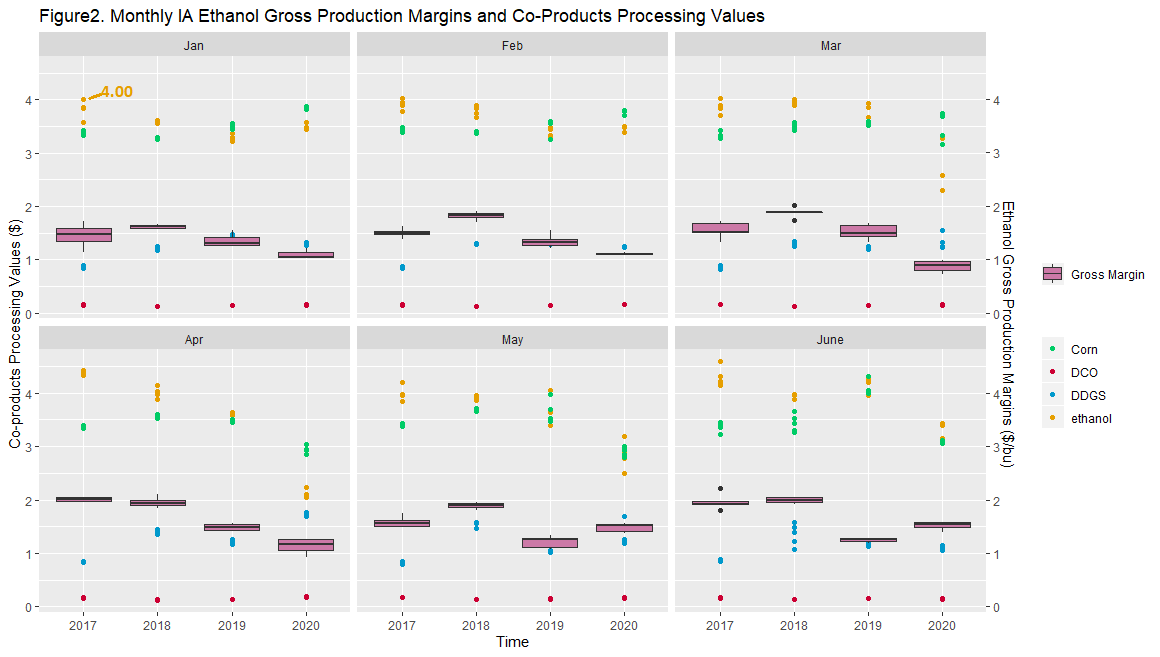
In Figure 2, the scatter points represent the weekly sales values (raw data from AMS reports) for corn, ethanol, DDGS, and DCO using green, yellow, blue, and red colors, respectively. For instance, in the January 2020 plot, the top yellow point corresponds to the ethanol sale value (gross value of ethanol sold per bushel of corn), $4.00, at the Week #1, 2017. The boxplots in pink color, represent the range of weekly IA ethanol GPMs. Still using the January plot as an example, the first box shows that the GPMs in January 2017 were in the range from $1.14/bu to $1.72/bu.
Applying ANOVA and Tukey-HSD test on the study period, i.e., January to June in 2017 to 2020, we found that the GPM numbers in the first four months in 2020 are at significantly lower levels compared to the previous three years; while the GPMs in May and June at 2020 are at the same level with 2019 May and June, although significantly lower than the same months in 2017 and 2018.
Applying the Pearson correlation test, we found that within the study period, corn price has had a strong, significantly negative effect in the months of January and February. And we found that in the second half-year from 2016 to 2019, there were strong significant negative effects between corn price and GPM as was found in our previous blog. But we found there has been a strong, significant, positive effect between corn price and GPM when 2020 April data is in the analysis.
The sale value of DDGS has had no significant effect on GPM for all months within the study period, except for April 2020. The sale value of DCO has had a significant, negative effect on GPM in the first four months of the study period, but after May, it has no significant effect. The sales value of ethanol has had a significantly positive effect on GPM before the month of May, and it has the strongest positive effect in the month of April.
In summary, corn price was the dominant variable in the second half-year within the last study period, and it has a significant negative effect. But based on this updated analysis, the ethanol price (ethanol value) has become the dominant variable. Although gasoline demand is slowly returning to normal, we have no idea how the pandemic will be manifest in the future. It may influence the ethanol price and value again which will lead to the different behaviors of GPM over the next several months or years.