My favorite breakfasts (yes, I have more than one) always include eggs in some form. If you have breakfast at Iowa Machine Shed here in Urbandale and you order an entrée with eggs you will get an extra egg just for telling your server “I Love Eggs”. Apparently, a lot of people share my love for eggs. According to the December 2018 issue of Egg Industry Magazine, “US per capita egg consumption is forecast to exceed 280 eggs in 2019”.
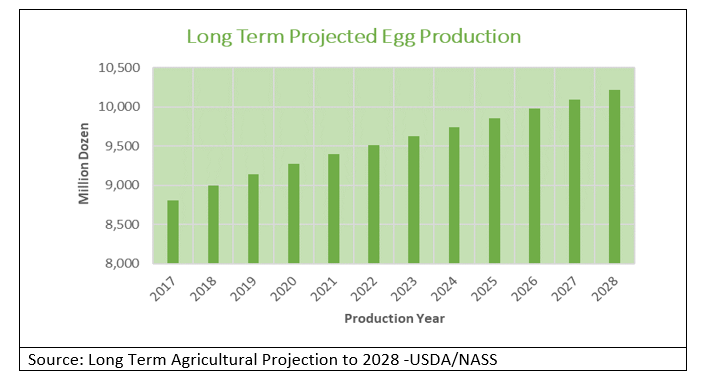
The USDA/NASS Long Term Agricultural Projections released this month are predicting egg production to grow from 8,808 million dozen in 2017 to 10,211 million dozen in 2028.

Now that fact is interesting enough in itself, but our team at Decision Innovation Solutions (DIS) takes information like this along with our expertise in the industry to help our clients understand the potential impact on their business. For example, if egg production is expected to go up, unless they develop a layer that lays more eggs per week, there will have to be an increase in the layer population. That means more barns, increased hatchery output and more feed consumption.
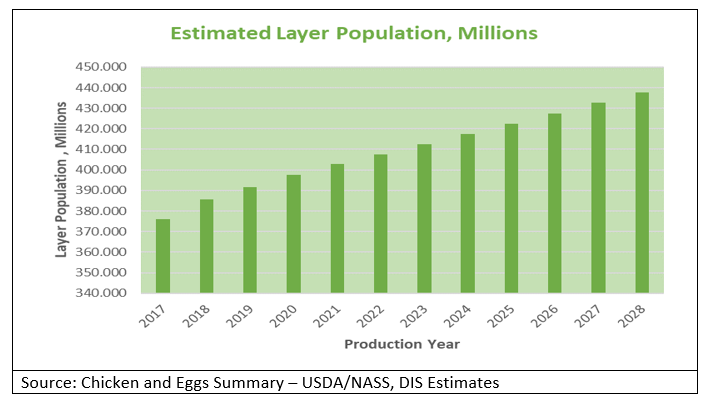
Using history on average number of eggs laid per 100 layers per day (Percent Lay) we can estimate the number of eggs laid per layer per year which provides a calculated estimate of the layer population in each production year. The following chart depicts the estimated layer population for each year in the USDA/NASS projection.

Now that we have the future layer populations, we can produce estimates on the amount of certain feed ingredients used in layer rations. Three of the more prominent ingredients in layer rations are corn, dried distillers grains with solubles (DDGS) and soybean meal. DIS has completed several projects for multiple clients focused on determining the quantities of these and other feed rations for all species of livestock and poultry. Based on this research we can estimate the percentage of the total ration for each of these three ingredients.
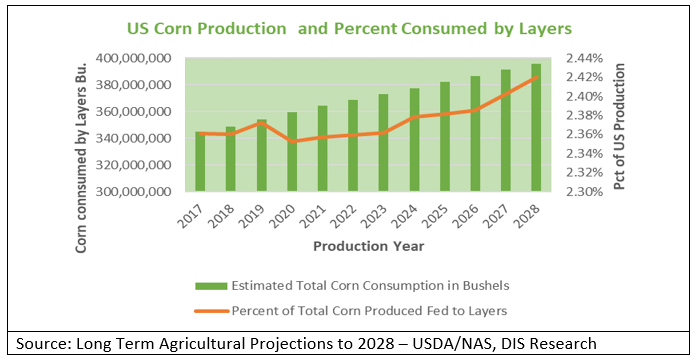
For corn we can estimate the bushels of corn used in layers rations directly. To that we calculate the additional bushels of corn that supply the DDGS portion of the ration. We know how many pounds of DDGS are produced from a bushel of corn processed by ethanol plants (X). So, we estimate the pounds of DDGS fed and divide that number by X to calculate the equivalent bushels of corn to add to the regular corn number.

The line in the above chart represents the percent of USDA’s projected total US corn production that will be fed to layers. As you can see, over the years a greater percent of total corn production is going to layers. This has implications for overall supply and competition with other livestock and poultry rations.
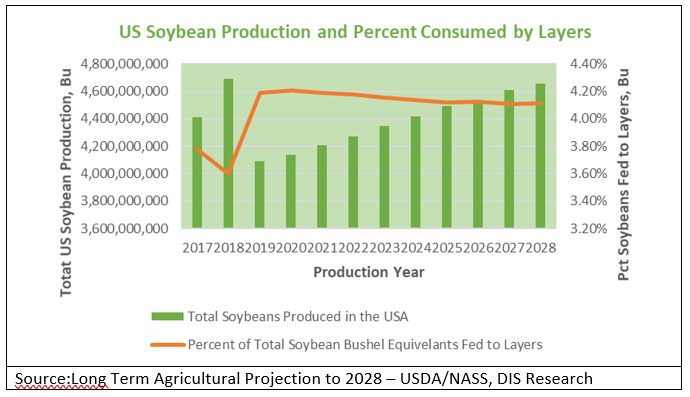
We can use a similar approach to estimate the bushels of soybeans required to produce the soybean meal portion of the layer’s rations. The following chart shows the soybean bushel equivalents needed each year and the percent of USDA’s projected total US soybean production that will be fed to layers. The percentage pattern is a little different compared to corn. The percent of total peaks in 2019 and then levels off for the reminder of the projection period. 2019 to 2024 might be a little interesting in the feed industry regarding soybeans as annual production grows each year from the 2019 projected low.

It is interesting that a lot of people in the US share my love for eggs. But, it is even more interesting to start with a basic piece of information like the expected increase in egg consumption and expand that to an analysis of the impact on related markets. That is what our team does and we enjoy the work and seeing how it helps our clients ask better questions, receive better answers and make better decisions.
Merlin Siefken
Business Development Manager
Decision Innovation Solutions

