Price Movements
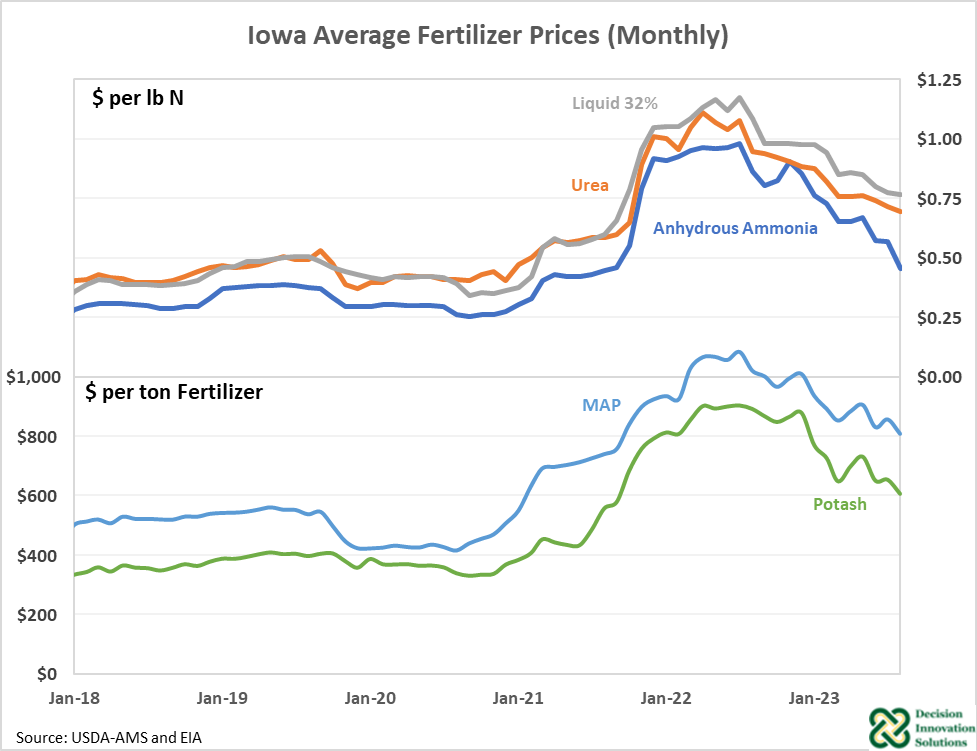
Iowa fertilizer prices began rising in 2021 and peaked during the summer of 2022 (Figure 1). Price peaks for each fertilizer were close to double their respective 2018-2020 average prices. Since the peak, prices have generally been trending down, though they still have not reached 2018-2020 levels.

Figure 1. Henry Hub Natural Gas and Iowa Fertilizer Prices
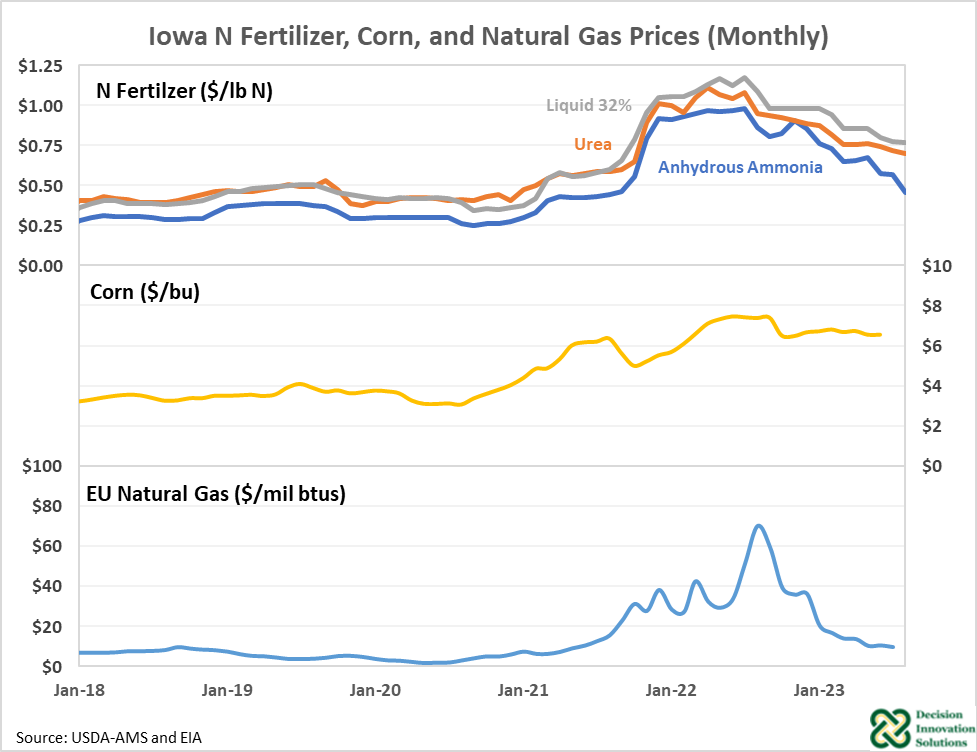
Fertilizer prices, especially nitrogen fertilizer prices, typically move with both natural gas and corn prices (Figure 2). Natural gas is a major input in the production of fertilizer, and therefore increases in natural gas prices can put upward pressure on fertilizer prices, especially nitrogen fertilizers. Fertilizer prices appear to follow EU natural gas prices closer than US natural gas prices. Given that fertilizer is a world commodity, and the EU is the marginal supplier of fertilizer to the market, this makes sense from an economic perspective.
Corn is a major user of nitrogen fertilizer, so it makes sense these prices are correlated as well. Both natural gas and corn prices are down from price levels last year. Fertilizer prices have come down as these two prices have decreased.

Figure 2. Iowa Anhydrous Ammonia, Corn, and Natural Gas Prices
Price Outlook
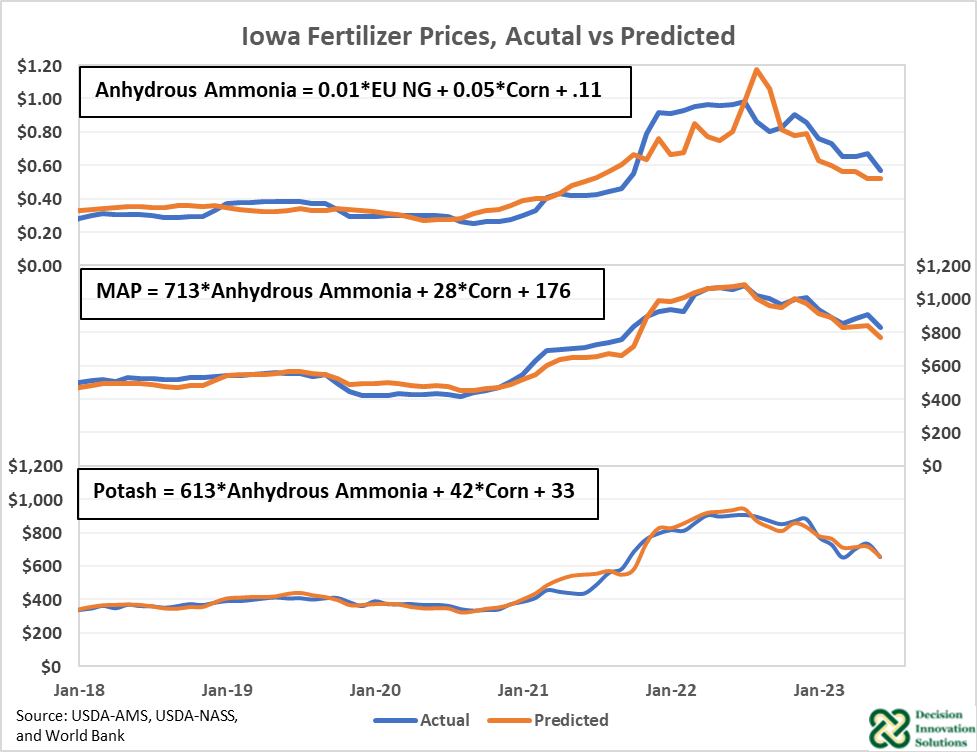
No one knows for sure what fertilizer prices will do in the future. Using historical price relationships, we can get an informed estimate. The following equations are obtained using data from 2011-2023:

The above These equations reflect the relationship of related Anhydrous Ammonia to EU natural gas prices and corn prices are as discussed above. Both MAP and potash are related to anhydrous ammonia and corn. Anhydrous ammonia is included because the fertilizer complex tends to move together. It is not an input in the product of either fertilizer. Figure 3 shows these equations do a pretty good job predicting ammonia prices as the different difference between the actual price (blue line) and the predicted price (orange line) is relatively small for all these fertilizers.

Figure 3. Actual Anhydrous Ammonia Prices vs Forecast ($/lb N)
Note these equations do not indicate any causality in price movements. Put another way, with only these equations, we cannot say for sure that high corn prices cause fertilizer prices to increase or vice versa. For example, below are two possible explanations for why higher corn prices lead to higher fertilizer prices:
- Higher Corn Price → Higher Fertilizer Demand → Higher Fertilizer Price
- High futures or expected corn prices influence farmers to plant more corn acres, leading to increased demand for fertilizer. Assuming fertilizer supply is fixed in the short run, this would lead to higher fertilizer prices.
- Higher Corn Price → Higher Farm Income + Fertilizer Market Power → Higher Fertilizer Price
- If market power exists in the industry, when corn prices increase, fertilizer companies could price fertilizer at what the market will bear to maximize their profits.
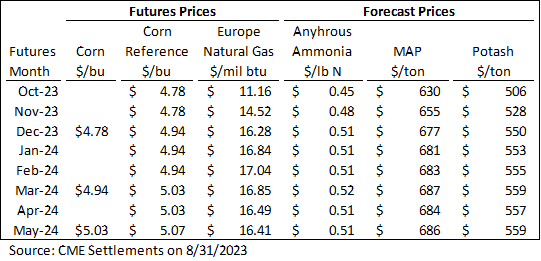
The futures market shows lower corn prices and higher natural gas prices in the coming months (Table 1). Next spring, futures prices have corn at $5.04 per bushel corn and natural gas at $3.43 per mil btu. Using the above equation, anhydrous ammonia prices would be forecast at $0.47 per lb-N.
Table 1. Future Prices and Forecast Prices

The above estimate for anhydrous ammonia prices is purely an estimate based on historic price relationships and current future prices. Many things could change between now and next spring and could cause the price to be different. Furthermore, large shocks to the market from the Russia-Ukraine conflict or other factors could also influence this price.

