Oregon Clean Fuels Program (Oregon CFP) was launched in 2016 by the Oregon Department of Environmental Quality. The program intends to reduce the amount of greenhouse gases generated during production, processing, transportation, and consumption (i.e., life cycle) of fuels used in the Oregon transportation sector. According to Oregon Department of Energy, the transportation sector accounts for about one-third of the state energy use.
CFP promotes the use of fuels with lower carbon emissions (carbon intensity – CI) compared to gasoline and diesel. Fuels with lower CI include ethanol, biodiesel, renewable diesel, electricity, and renewable natural gas. According with the program, the baseline year for the program (2015) represents 10% ethanol blended with gasoline and 5% biodiesel blended with diesel. CFP goal is to reduce by 10% in average carbon intensity from 2015 levels by 2025. CFP has three fuel standards, which are the annual average CI that a regulated party[1] must comply with. The first standard is for gasoline and gasoline substitutes, the second is for diesel and diesel substitutes, and the third one is for alternative jet fuels. Figure 1 shows the annual average clean fuel standards from 2016 to 2025. The reduction in CI of Oregon’s transportation fuel pool was equal to 0.25% and 1.5% in 2016 and 2019, respectively, and by 2025 the expected reduction is forecast at 10% (see Figure 2).
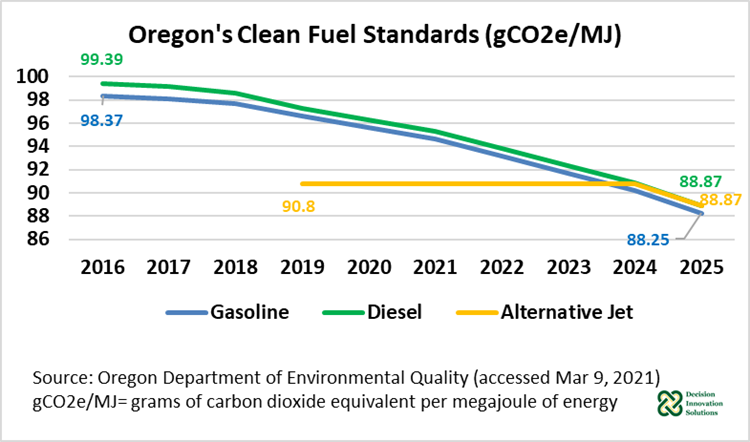
Figure 1. Oregon Clean Fuel Standards (Gco2e/MJ)
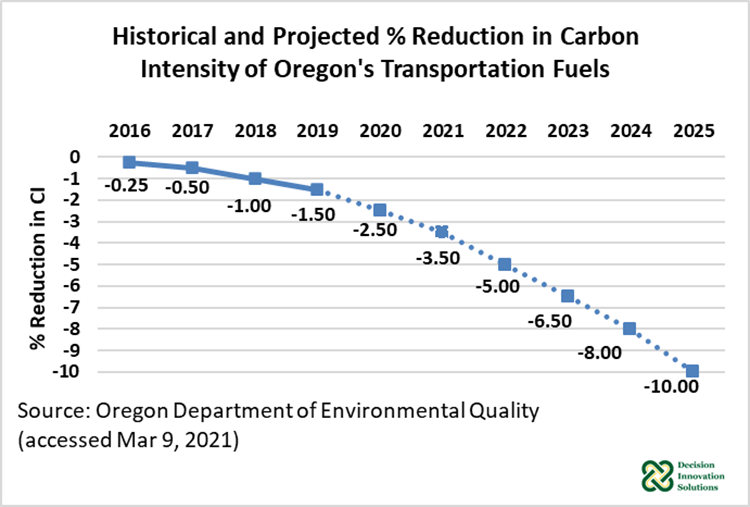
Figure 2. Historical and Projected % Reduction in Carbon Intensity of Oregon’s Transportation Fuels
Clean Fuels Program Credits
Credits are generated when the CI of a specific fuel is lower than the corresponding clean fuel standard in a particular year. In contrast, deficits occur when a fuel has higher CI than the corresponding clean fuel standard in a particular year. One credit equals one metric ton of carbon dioxide equivalent not emitted resulting from the use of a fuel with a carbon intensity lower than the applicable clean fuel standard for a given year. For example, in 2016 which was the first year of the program, 831,189 metric tons (MTs) of carbon dioxide were not emitted by using fuels that had a CI below that year’s target. Sixty two percent of those credits were generated by ethanol (513,930 credits), while 32% (269,650) were generated by biodiesel. The rest of credits were from “other” fuels, such as natural gas, electricity, and biogas, among others (see Figure 3). Credits have been increasing consistently since the beginning of the program. In 2019, credits were up 54% to 1.276 billion compared with 2016. Both ethanol and biodiesel continued as the top credit generators, although in the case of ethanol, its share to total credits declined. In 2019, ethanol generated 553,768 credits, which accounted for 43% of total credits. On the other hand, during the same year biodiesel generated 447,034 credits, which represented 35% of total credits. “Other” fuels increased their participation in the program as well, generating 129,802 credits (10% of total credits). Renewable diesel is a fast-growing fuel in the Oregon market in terms of credit generation for the CFP. Renewable diesel started generating credits in the last quarter of 2017 with 2,863 credits (0.3% share), and by 2019, this biofuel generated 145,342 credits, which accounted for 11% of total credits.
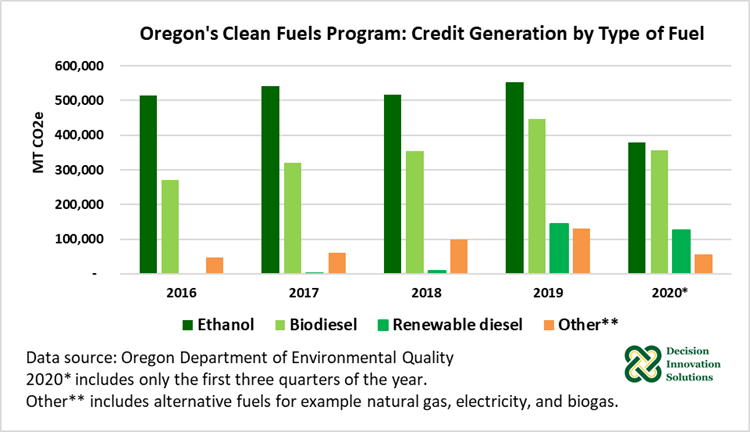
Figure 3. Oregon's Clean Fuels Program: Credit Generation by Type of Fuel
The most recent data, which includes the first three quarters of 2020 only, indicates ethanol credits (378,868) made up 41% of total credits (916,671), while biodiesel and renewable diesel accounted for 39% (355,860 credits) and 14% (126,198 credits) of total credits, respectively (see Figure 4). During the first three quarters of 2020, Oregon imported/produced 112 million gallons of ethanol, 50 million gallons of biodiesel, and 15 million gallons of renewable diesel (see Figure 4).
Because of the different CI of biofuels, the number of gallons to generate one credit varies across biofuels. Biofuels with lower CI generate more credits per gallon. For ethanol, which in 2020 (quarter 1 to quarter 3) had an average CI of 55.38 gCO2e/MJ, it took 294.4 gallons to generate one credit, compared to 141 gallons of biodiesel and 115.4 gallons of renewable diesel. In 2020 (quarter 1 to quarter 3), the CI of biodiesel and renewable diesel was estimated at 41.06 gCO2e/MJ and 39.87 gCO2e/MJ (on average), respectively.
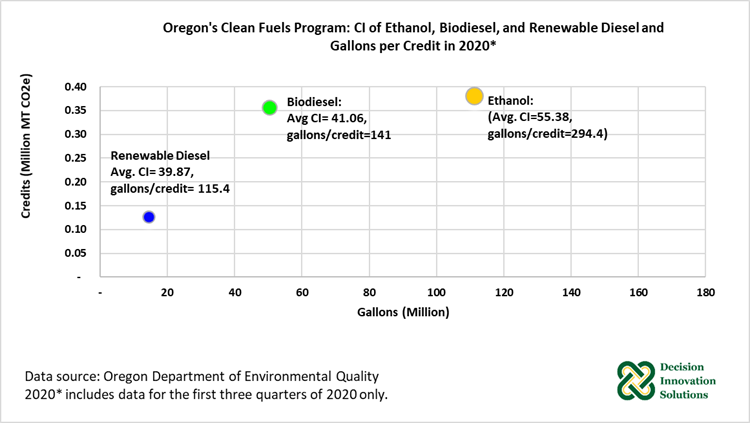
Figure 4. Oregon's Clean Fuels Program: Credits Generated by Ethanol, Biodiesel, and Renewable Diesel and Gallons Sold in 2020
2016-2020 Summary
From 2016 to 2020 (January to September), Oregon’s Clean Fuels Program has generated almost 5.0 million credits, equivalent to 5 million MT of carbon dioxide equivalent not emitted by promoting and selling fuels with carbon intensities lower than the stipulated clean fuel standards. The main contributor to those credits was ethanol with 2.503 million credits (51% share of total credits), followed by biodiesel with 1.749 million credits (35% share) (see Figure 5). With less than 0.5 million credits were “other” fuels (0.393 million, 8% share) and renewable diesel (0.284 million, 6% share). Note that renewable diesel entered the market in the last quarter of 2017.
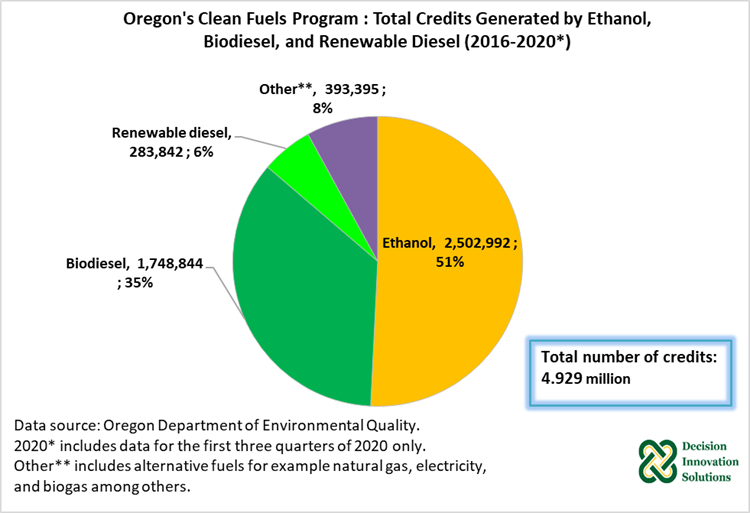
Figure 5. Oregon’s Cleans Fuel Program: Total Credit Generated by Ethanol, Biodiesel, and Renewable Diesel (2016-2020)
From 2016 through the first nine months of 2020, the Oregon market sold about 784 million gallons of ethanol, 260 million gallons of biodiesel, and 33 million gallons of renewable diesel (see Figure 6). The volumes[2] of each of these biofuels sold in the Oregon’s market during that period, were directly related with the number of credits generated by each of these biofuels (see Figure 5).
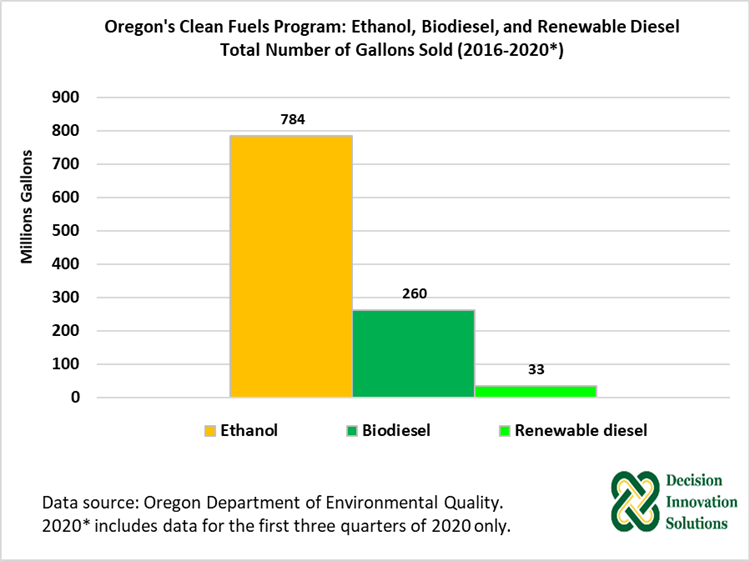
Figure 6. Oregon’s Clean Fuels Program: Ethanol, Biodiesel, and Renewable Diesel Total Number of Gallons Sold (2016-2020)
2021 Oregon Clean Fuels Program Outlook
Each year, Oregon office of Economic Analysis (OEA) with the assistance of Oregon Department of Environmental Quality determines if the fuel supply will be enough to generate the required number of carbon reduction credits to achieve the scheduled applicable low carbon fuel standards for the compliance period. As indicated before, these carbon credits are generated from alternative fuels including ethanol, electricity, and diesel substitutes such as biodiesel, renewable diesel, natural gas, and propone.
Based on blend rates assumptions which are guided by historical observations and trends, as well as observed blend rates in California, Oregon projections[3] for fuel consumption are elaborated each year. These projections indicate that in 2021 the Oregon market would consume 172.9 million gallons of ethanol. The 2021 ethanol blend rate is projected at 10.1% up from 10.0% in 2019 due to the adoption of some E85 blending. For biodiesel, the 2021 forecast indicates that 78 million gallons of this biofuel would be consumed in Oregon, which would be up 14% from the volume in 2019. The blend rate for biodiesel is expected to increase from 7.6% in 2019 to 9.6% in 2021. The 2021 expected consumption of renewable diesel was estimated at 59.3 million gallons, if realized, it would increase 88.1% from the 2019 volume. The 2021 forecast blend rate for renewable diesel in Oregon is 7.3%, which would be up from 2.1% in 2019. This forecast was driven by California’s upward trend in the renewable blend rate in recent years.
[1] Regulated parties in the CFP are importers of gasoline, diesel, ethanol, and biodiesel. Importers are those entities who have ownership title to a transportation fuel from an outside location at the time and is brought to Oregon. Local producers of ethanol and biodiesel are also regulated parties. Importers with less than 500,000 gallons of transportation fuel/year are exempted from the Clean Fuel Standards.
[2] Not included in these volumes are the gallons of biofuels sold through blends (e.g., E10, E85, and B5 and the volumes of renewable diesel mix into diesel).
[3] 2021 Clean Fuels Forecast (https://www.oregon.gov/deq/ghgp/Documents/cfp-Forecast2021.pdf)

