

DIS PV Scores: The Right People, The Right Outreach, The Right Time
It seems like just yesterday that the surprise electoral victory of President Trump took place, so it may seem a bit premature that we’re already focusing in on the next general election in November 2018. In our opinion, it is never too early to continue to better understand voter demographics. Over the years, the Decision Innovation Solutions team has helped clients in their efforts to refine their outreach to likely voters of differing backgrounds.
A key tool we’ve found useful in helping our clients get the biggest “bang” for their outreach “buck” has been the calculation of a “propensity to vote” (PV) score. To calculate a PV score for voters, DIS attains a list from a given Secretary of State’s office. These lists generally have a few key demographical variables (age, gender, party affiliation, etc.) along with history of voting events (year of election and the method used to vote, not how they voted). Using the data in these lists we can quantify the relative importance of available (within the dataset itself) or calculated independent variables that contribute to whether a given voter will in fact vote in the next election.
2018 Non-Presidential General Election Project
For the most recent work completed with the Iowa voter list, we identified the following as important variables for calculating the propensity to vote in the next (2018) non-presidential general election either at the poll or absentee:
- Party (Republican, Democrat and No Party/Other Party)
- Gender (Male and Female)
- Age Class (One of five)
- Various summarizations of voting events
A professional statistical software package (SAS) was used to run the variables in our model. PV scores were generated for all voters. These PV scores range from 0-100, with 100 meaning a voter will very likely vote, while a 0 means a voter will very likely not vote.
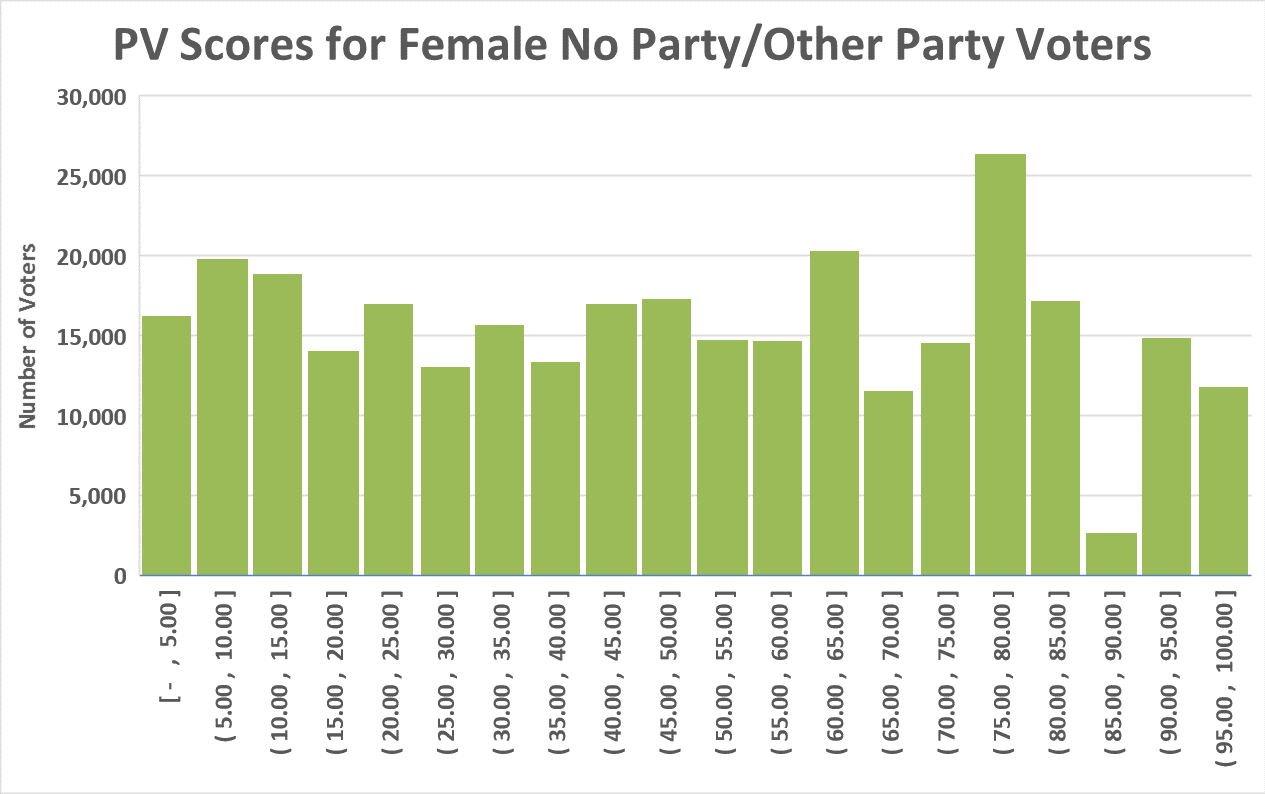
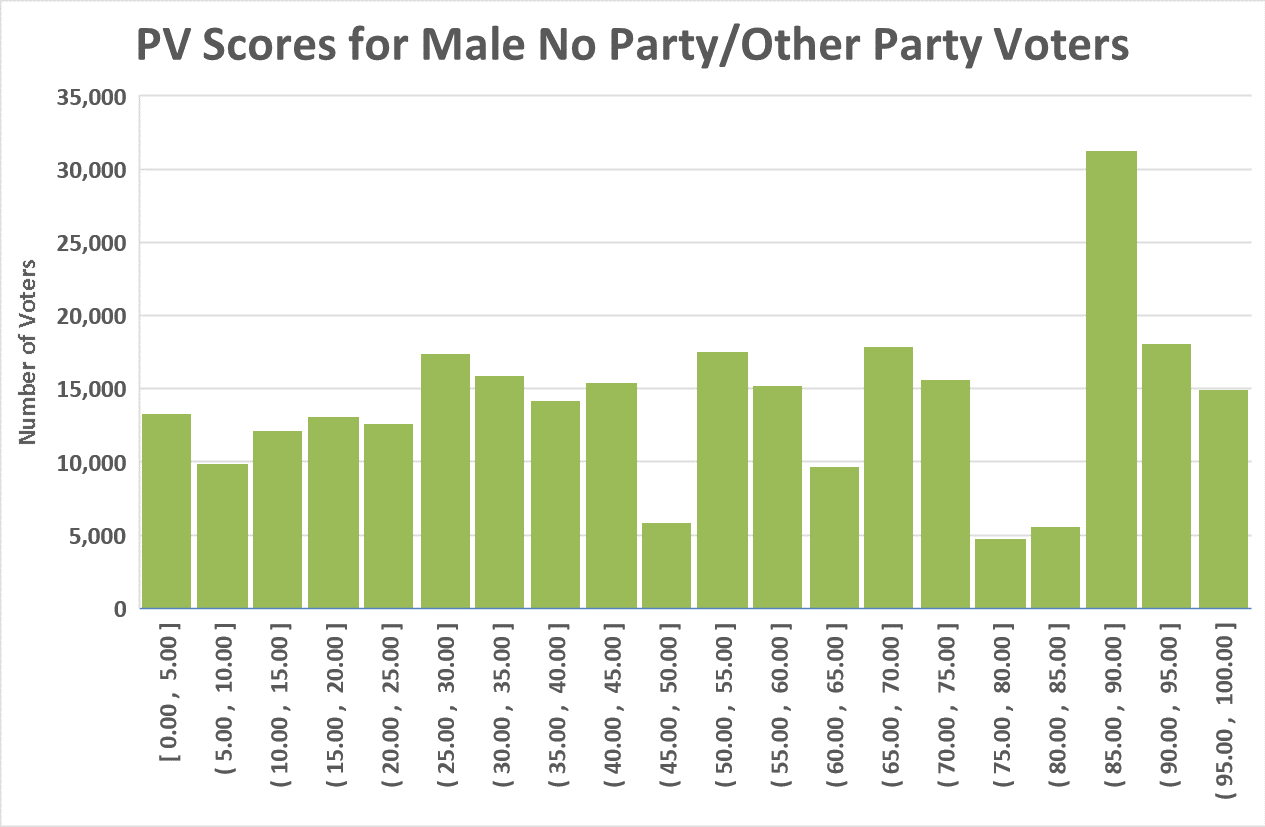
Below are two histograms depicting the distribution of PV scores for Female and Male “No Party/Other Party” voters. When divided in to twenty “bins”, the PV score of each gender is visibly different from the other (i.e., male No Party/Other Party voters have a higher propensity to vote in a non-presidential general election). Additional histograms could be created for age and other available variables for all three “parties” for which PV scores have been created.
Further “In-Depth” Analysis
As mentioned, the above charts represent the PV scores for the next (2018) non-presidential general election regardless of voting method (at the poll or absentee). With the many combinations of elections (primary, general, presidential, non-presidential) and voting methods (at poll and absentee), the following additional PV score reports could be generated and tailored to a client’s specific need:
- Propensity to vote at the poll in a non-presidential general election
- Propensity to vote absentee in a non-presidential general election
- Propensity to vote in a presidential general election, regardless of method (absentee or at the poll)
- Propensity to vote at the poll in a presidential general election
- Propensity to vote absentee in a presidential general election
- Propensity to vote in a non-presidential primary election, regardless of method (absentee or at the poll)
- Propensity to vote at the poll in a non-presidential primary election
- Propensity to vote absentee in a non-presidential primary election
- Propensity to vote in a presidential primary election, regardless of method (absentee or at the poll)
- Propensity to vote at the poll in a presidential primary election
- Propensity to vote absentee in a presidential primary election
Valuable Applications
In addition to creating the PV scores for all voters in a designated area, these scores and other demographical data from a given organization’s membership database provide insight into that organization’s membership profile. This knowledge can then translate to more pointed and accurate outreach to members, refinement of prospect lists, etc. Furthermore, using the described methodology increases the efficiency of spending in this area and allows an organization to reach the right people, with the right efforts, at the right time.
As we continue our work in this area, we’re excited for upcoming opportunities to tailor these analytical methods to the needs of our clients. As with others who have used this service, our clients will also see the impact that improved voter and membership insight will provide to their unique industries and outreach efforts.