I have a Google alert set for Economic Contribution and another for Economic Impact. This gives me a great overview of the plethora of studies commissioned by clubs, resorts, businesses, counties, states and non-profits all seeking to justify their contribution to society.
The challenge is in knowing if you can trust the results of the study. For instance, can you compare the results of your study with those of similar entities? Most of the studies use an input – output model developed by MIG, Inc. called IMPLAN (Impact Analysis for Planning).
Since the team I work with at Decision Innovation Solutions has developed a methodology that is logical and consistent with guidelines published by IMPLAN, our clients can spend their time communicating the results instead of defending the methodology.
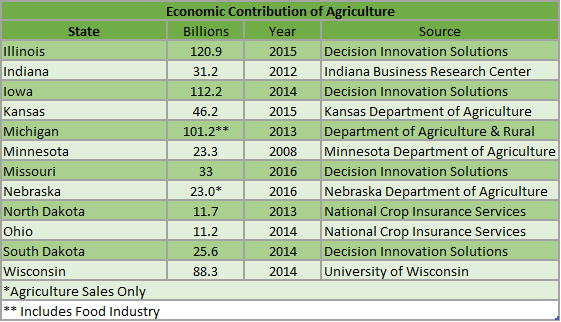
Wouldn’t it be great if you could compare your results with others? For instance, let’s say you are the Secretary or Director of your states’ Department of Agriculture. Your primary concern would be to have accurate information when representing your constituents. However, it would also be important that you can compare your state with others. That is difficult when you know different methodologies and time frames were used in other states. Look at the following chart which was created from currently available economic contribution reports from each of the 12 states in the Midwestern Association of State Departments of Agriculture (MASDA). There may be other studies out there but this is what I found in my search.

Notice the range of years, 2008 to 2016. Two of the states are probably not comparable due to inclusion of industries that should not be included in an Agriculture contribution study or including sales only which does not capture the full contribution.
I have a proposed solution. If all 12 states in MASDA would collaborate with Decision Innovation Solutions (DIS) to develop an economic contribution of agriculture study (AECS) for each of the states in the 12-state region, everyone would have a defensible and comparable report. Each state would have information presented by county, congressional district and the state. DIS has already completed studies for 5 of the 12 states in MASDA. MASDA, let’s talk.

