

Despite the COVID-19 pandemic, the USDA’s latest U.S. farm income data released on September 2, projects U.S. net farm income up 22.7% to $102.7 billion (in nominal terms) in 2020 compared with the previous year (Figure 1); however, if realized, 2020 U.S. net farm income would be 17% below the 2013 level ($123.7 billion). Inflation adjusted (2020 dollars) net farm income is forecast to increase 21.7% year over year but down 25.4% relative to the 2013 level (137.6 billion).
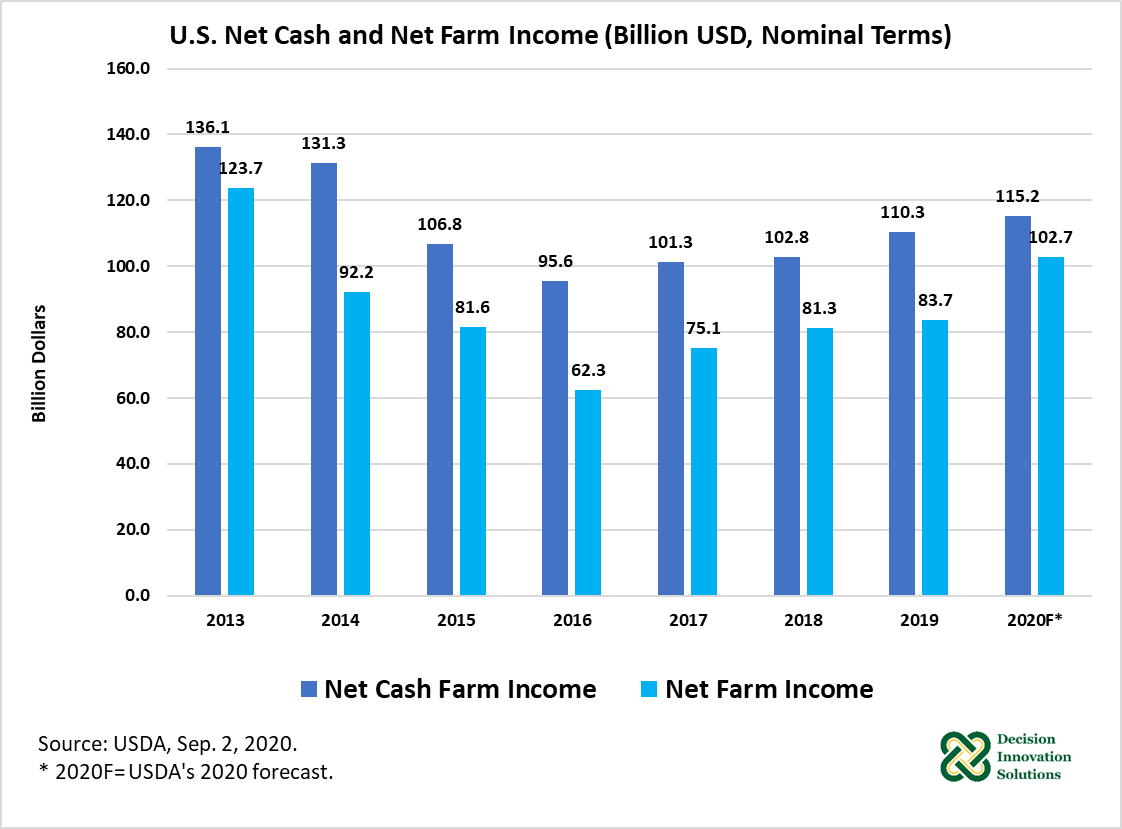
Figure 1. U.S. Net Cash and Net Farm Income (Billion Dollars)
Cash receipts (in nominal terms), from crops are expected to increase 1% to $196. 6 billion in 2020 from 2019, at the same time, 2020 cash receipts from animals & animal products are forecast to decline 8.1% to $161.7 billion year over year. When combined, cash receipts from both crops and animals & products are forecast down 3.3% ($12.3 billion) to $358.3 (nominal terms) from 2019. In inflation-adjusted 2020 dollars, cash receipts are forecast to drop 4.1% from 2019 ($$373.5 billion) and 20.3% from 2013 ($449.4 billion).
Cash farm-related income[1] is expected to decline as well, from $34.7 billion in 2019 to $33.3 billion (in nominal terms) in 2020. In contrast, government payments[2], one of the components of farm cash income, are forecast to increase 65.7% to $37.2 billion in 2020 relative to last year. The increase in government payment is due to the supplemental and ad hoc disaster assistance for COVID-19 payments.
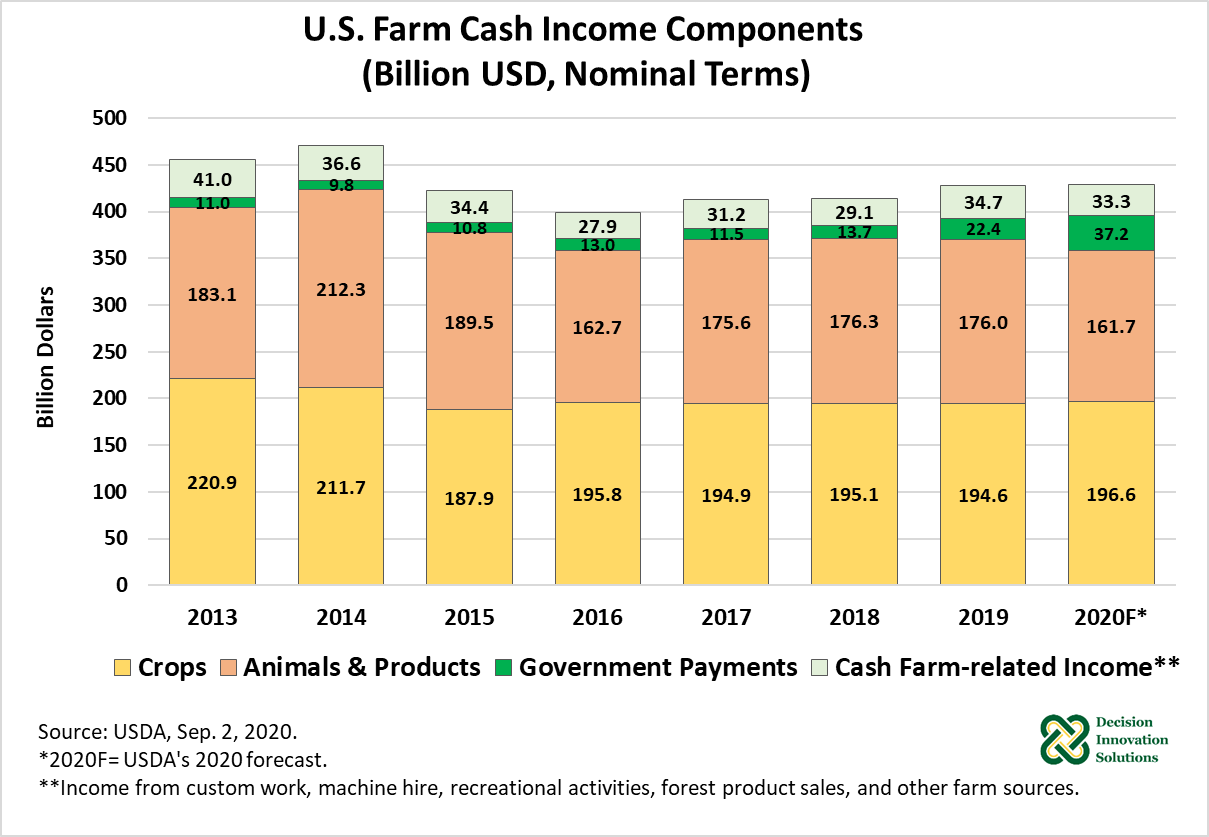
Figure 2. U.S. Farm Cash Income Components (Billion USD, Nominal Terms)
Cash receipts (in nominal terms) from cattle & calves sales are projected to fall 7.7% to $61.2 billion in 2020 year-over-year. Sales from cattle and calves are 17.1% of total cash receipts. 2020 cash receipts from hog sales are projected to decline 15.9% to $18.521 billion from last year (see Figure 3), and represent 5.2% of total cash receipts in 2020. Projected lower prices for cattle & calves and hogs are the leading factors in their expected decline in cash receipts during 2020.
Overall, cash from crop sales ($196.6 billion, nominal terms) are expected to make up about 54.9% of sales from all commodities, with receipts from corn and soybean sales representing 13.1% and 9.5%, respectively. Both 2020 cash receipts from corn ($46.9 billion) and soybeans ($33.9 billion) are forecast to decline 6.2% and 0.7%, in 2020 from the value of sales in 2019, correspondingly, (see Figure 3). According to USDA, in the case of corn, projected lower prices in 2020 are leading the expected decline in corn cash receipts, whereas in the case of soybeans, lower sales volumes are expected to offset the projected increase in prices. Compared with 2019, cash receipts projected to increase in 2020 includes fruits & nuts (17% to $33.6 billion) and potatoes (12.8% to $4.1 billion).
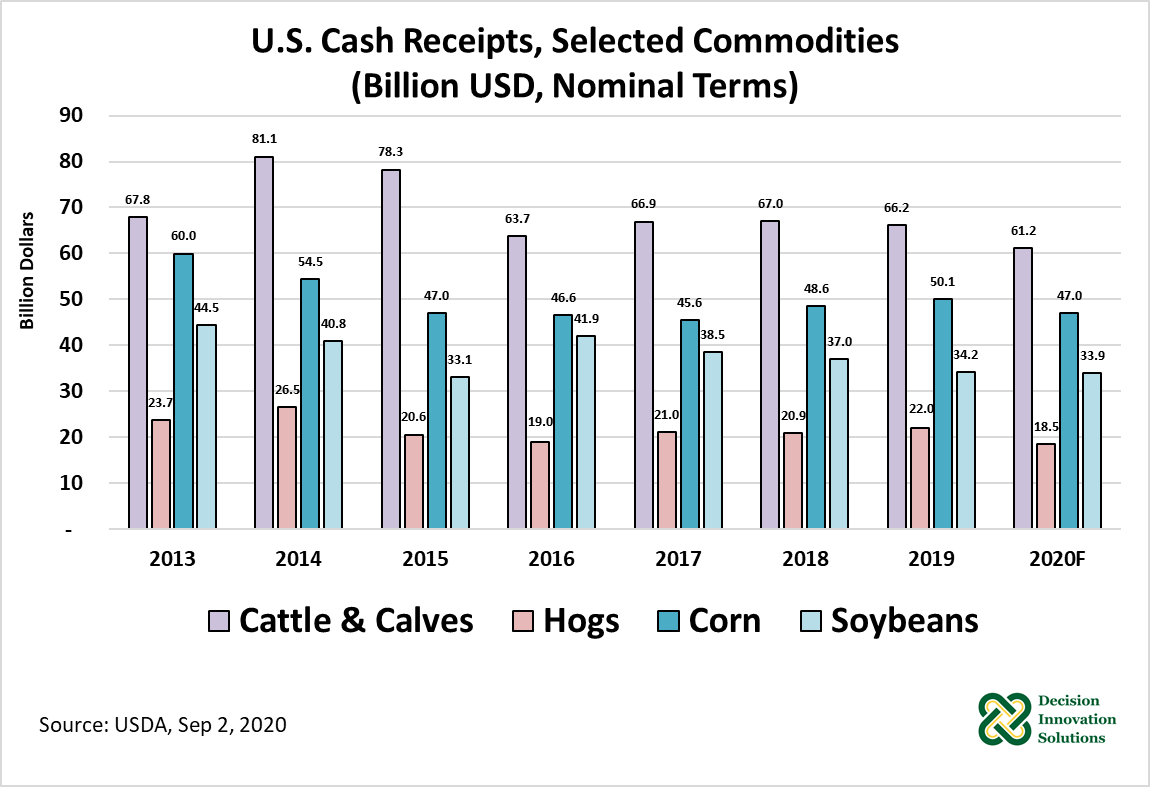
Figure 3. U.S. Cash Receipts, Selected Commodities (Billion USD, Nominal Terms)
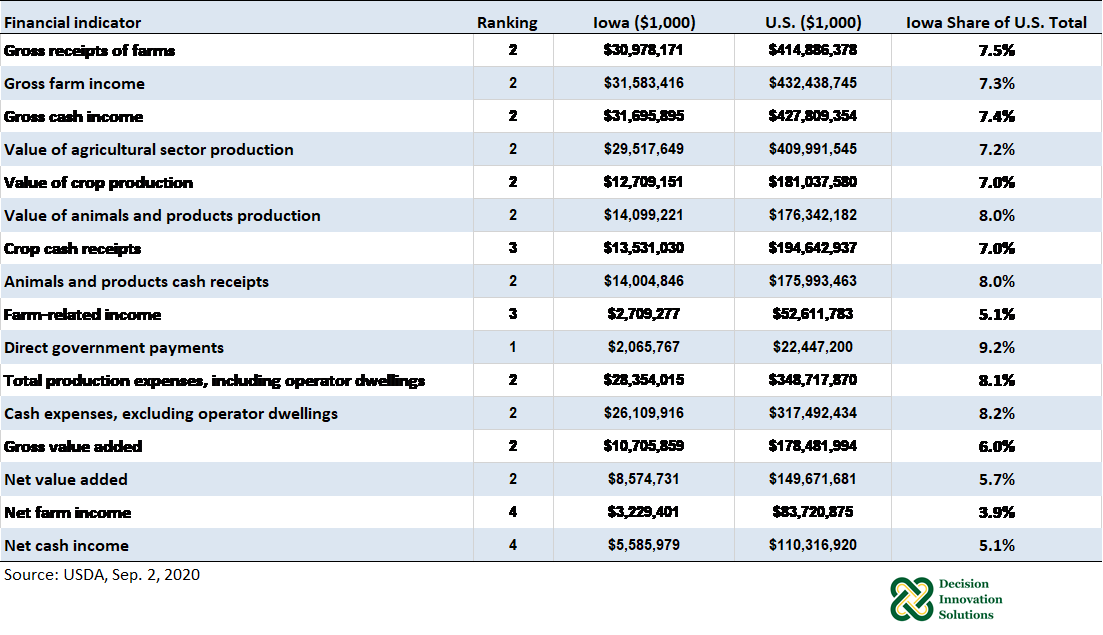
Iowa Agricultural Ranking
In the data released on September 2, 2020, USDA also revised 2019 farm income estimates at the state level. As Table 1 shows, Iowa ranked as the number two agricultural state in 2019 for the majority of farm finance indicators estimated/revised by USDA.
Table 1. Farm Finance Indicators, 2019 Iowa Ranking, Nominal Values
[1] Income from custom work, machine hire, recreational activities, forest product sales, and other farm sources.
[2] Include Federal farm program payments paid directly to farmers and ranchers but exclude USDA loans and insurance indemnity payments made by the Federal Crop Insurance Corporation.