

2018 ARC and PLC payments were issued in early October. Very few Iowa counties received any ARC-CO payments again this year. Final 2018/19 MYA prices were $3.61 for corn and $8.48 for soybeans, which resulted in a final 2018 PLC payment rate of $0.09 for corn but $0 for soybeans.
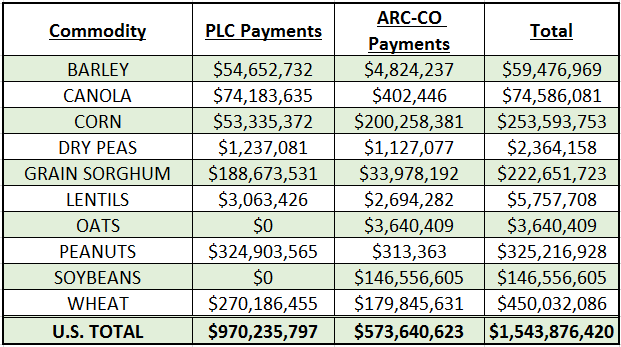
Below you will see total payments for both ARC-CO and PLC by commodity. Peanuts, wheat, and grain sorghum were the highest commodities for PLC payments, while corn, wheat and soybeans were the commodities with the largest ARC-CO payments.
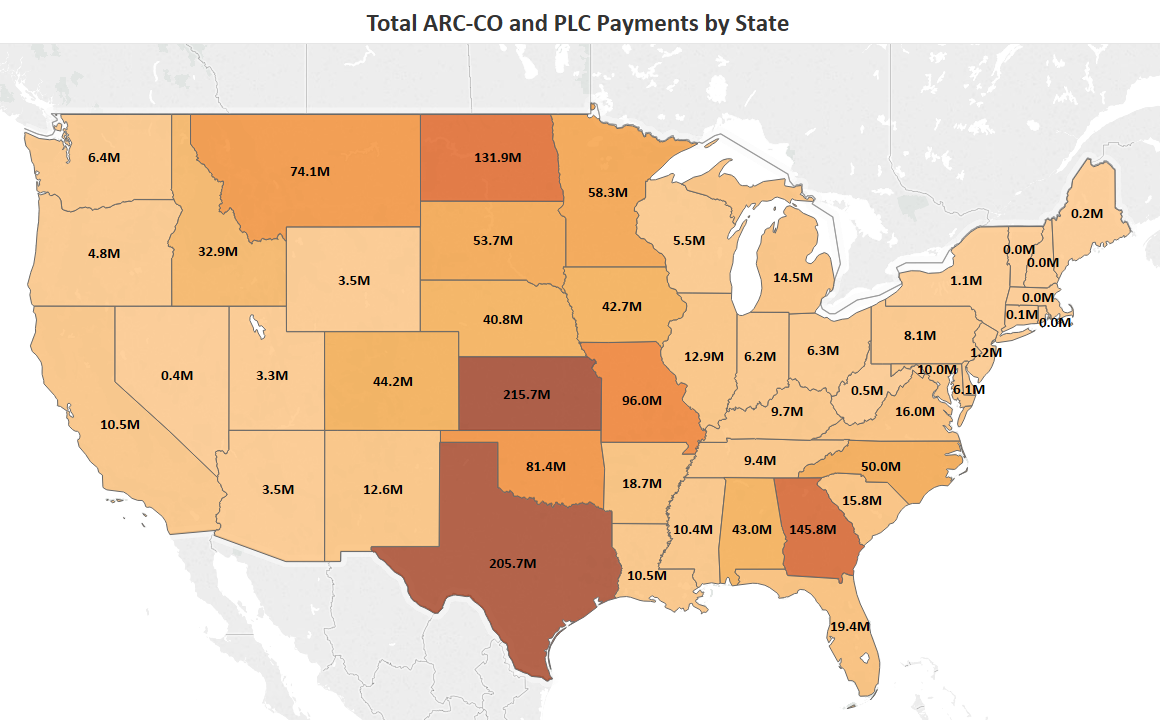
Kansas and Texas led the way for states with the highest amount of ARC-CO and PLC payments, followed by Georgia, North Dakota and Missouri.
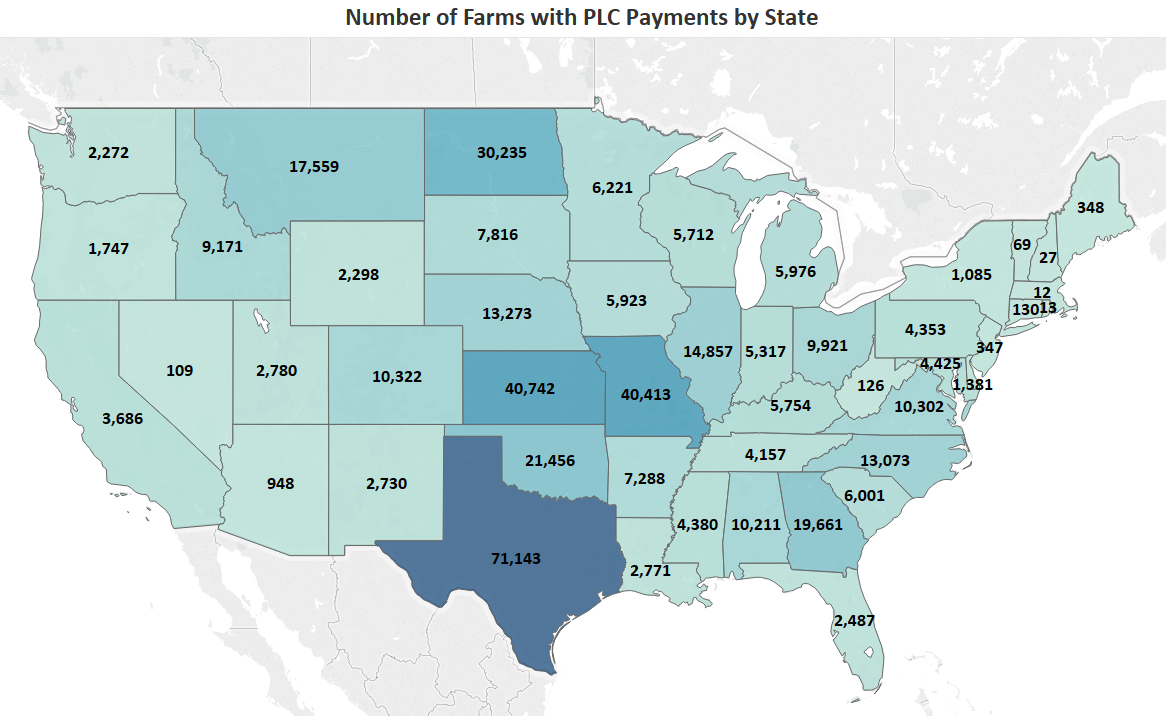
Texas was the state with the most farms receiving PLC payments with over 71,000 farms. Iowa only had about 5,900 farms that received PLC payments.
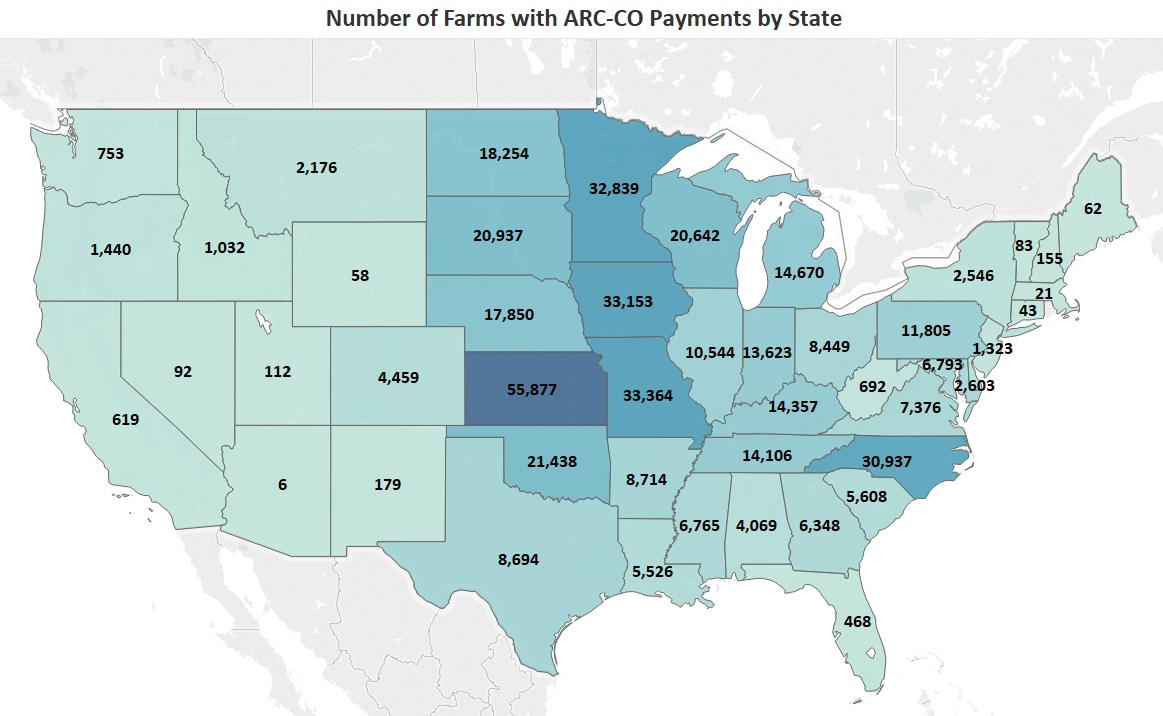
Kansas was the leading state for number of farms receiving ARC-CO payments at nearly 56,000 farms. Iowa, Missouri, Minnesota and North Carolina all had around 30,00-33,000 farms with ARC-CO payments received.
Final FSA yields used to calculate ARC-CO payments are shown below. Iowa FSA yields ranged from 139/bushel in Lucas County to 225 bushels/acre in Marshall County. The red shaded counties had an actual FSA yield lower than their respective 2018 benchmark county yield.
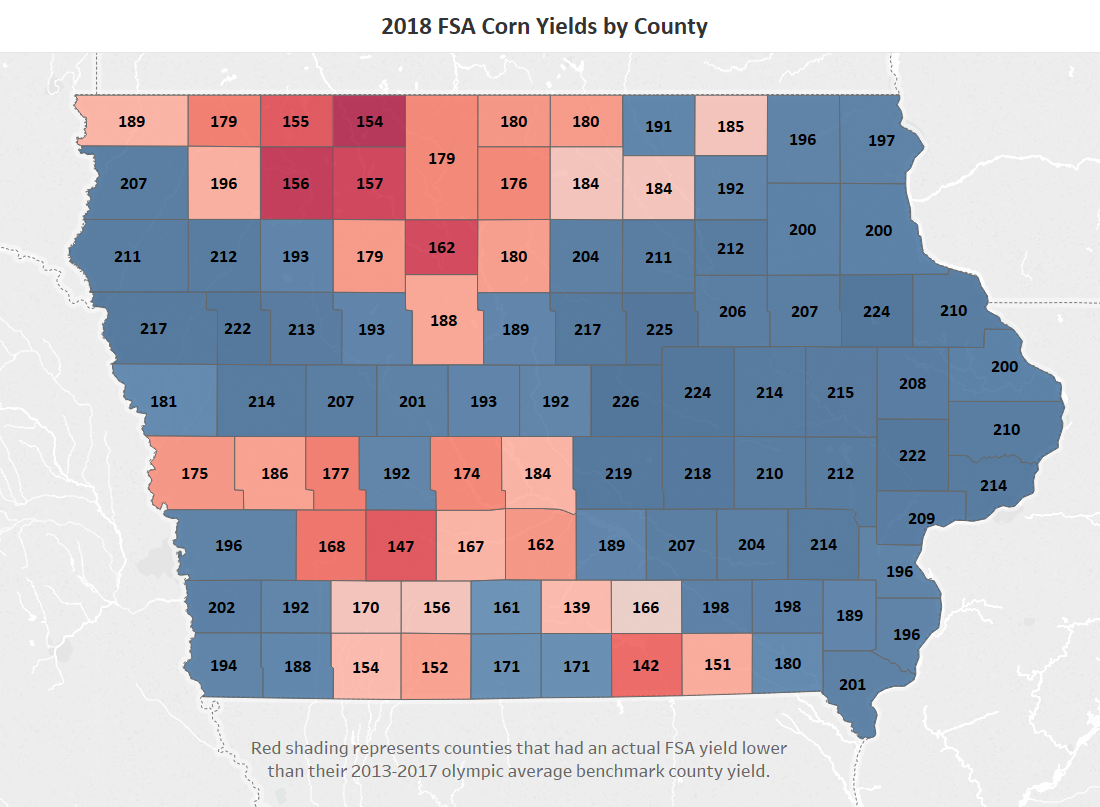
As you can see, ARC-CO payments follow a similar pattern to low yielding counties and were more likely in counties with an actual yield less than their 2018 county benchmark yield (shown as red shading in map above).
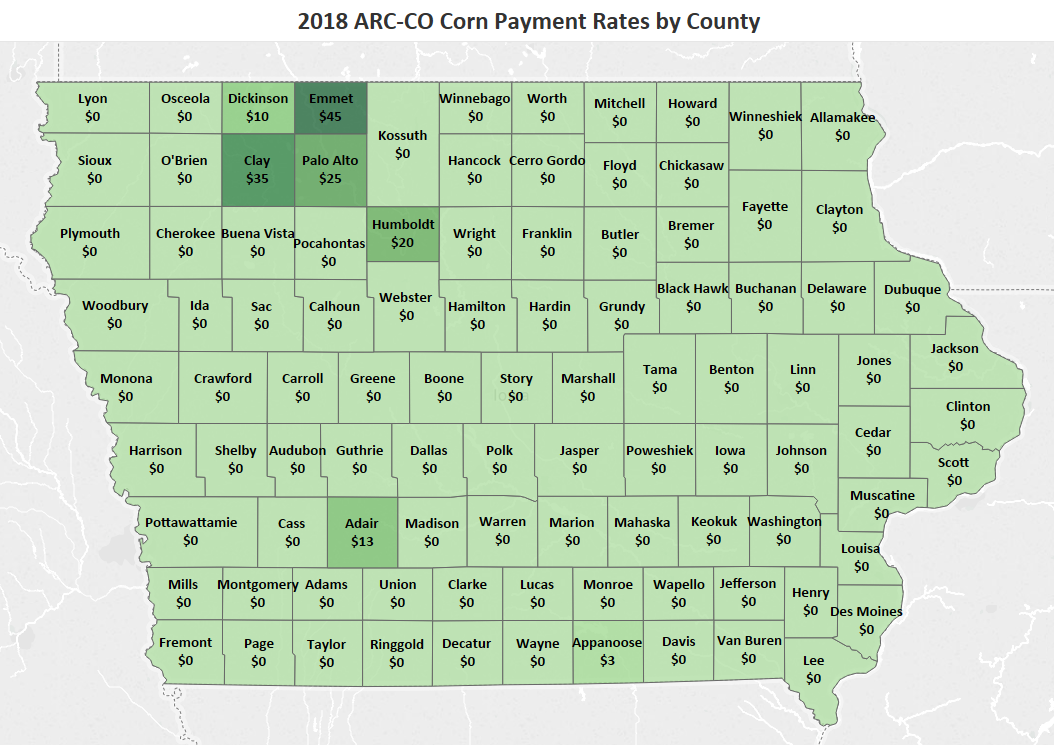
*Note that payments are only made on 85% of base acres
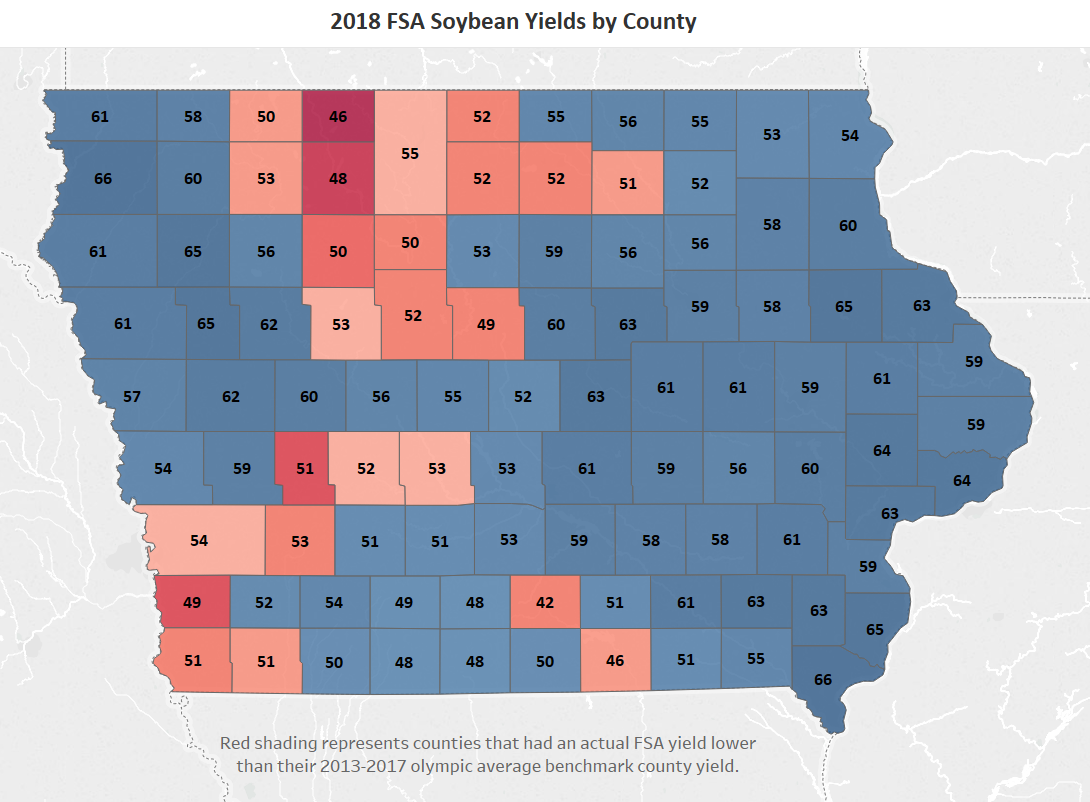
Iowa soybean FSA yields ranged from 42 bushels/acre in Lucas County to 66 bushels/acre in both Sioux and Lee counties. The red shaded counties had an actual FSA yield lower than their respective 2018 benchmark county yield.
Again, ARC-CO soybean payment rates follow a similar pattern to the lower yielding counties and were more likely in counties with an actual yield lower than their benchmark yield (shown in the map above) and ranged from $0 across much of the state to $49 in Emmet County.
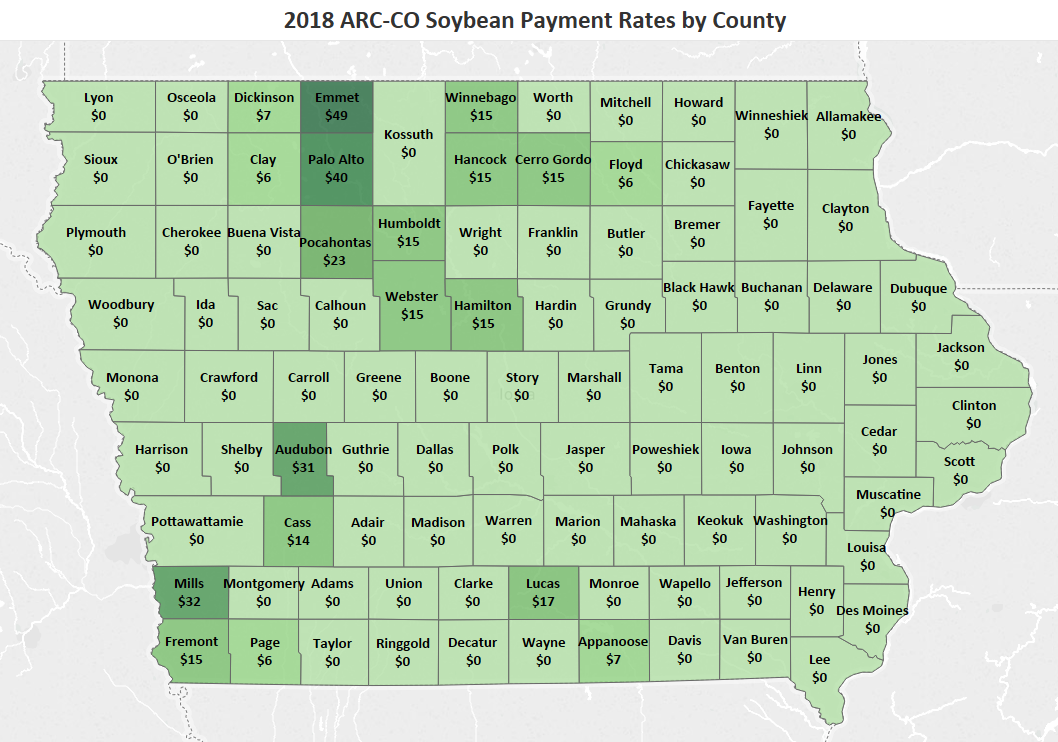
*Note that payments are only made on 85% of base acres