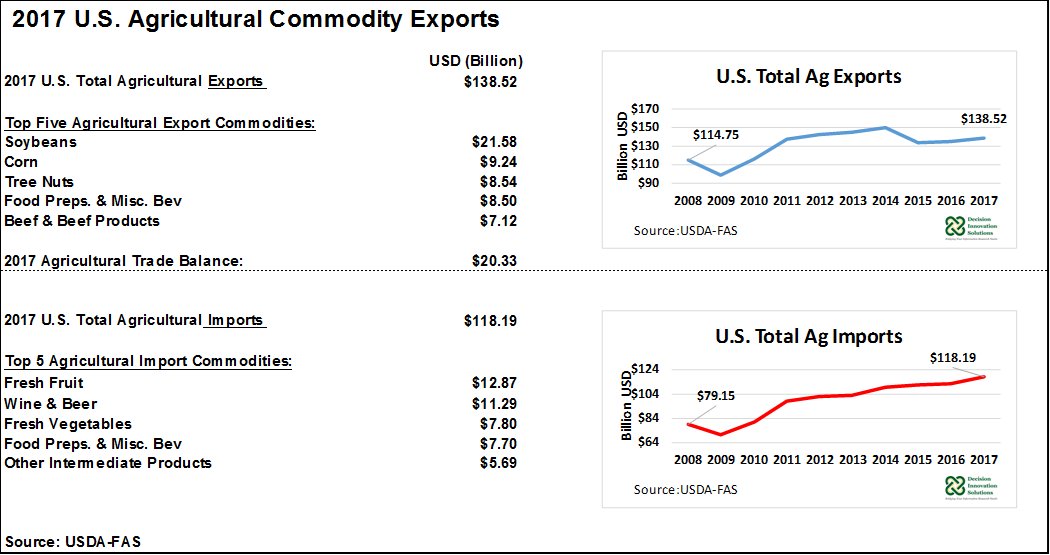
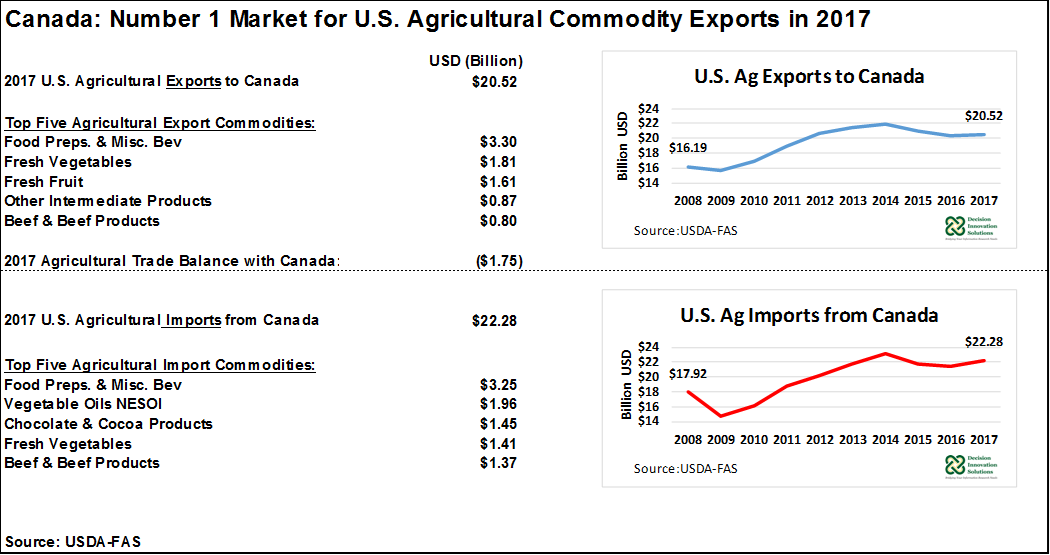
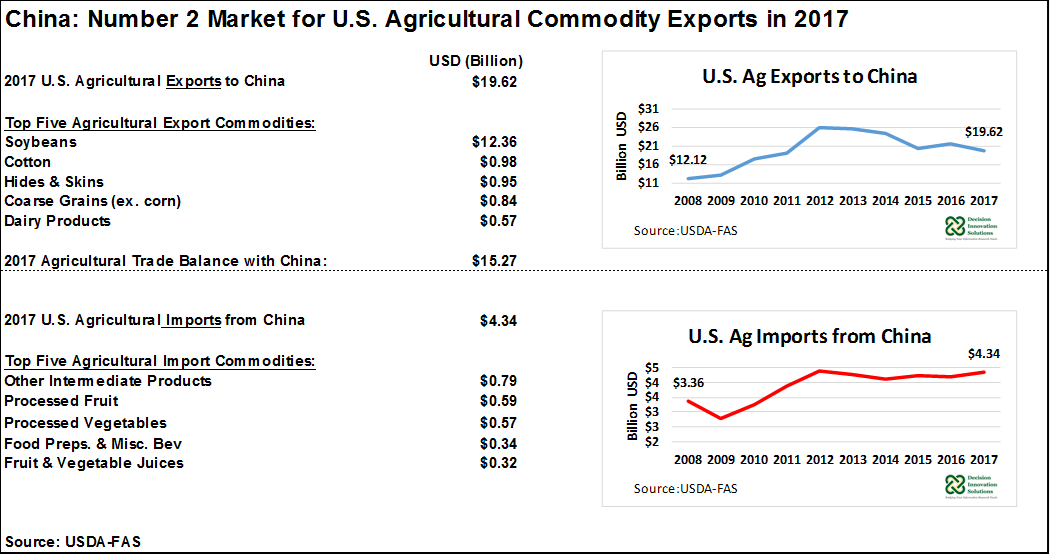
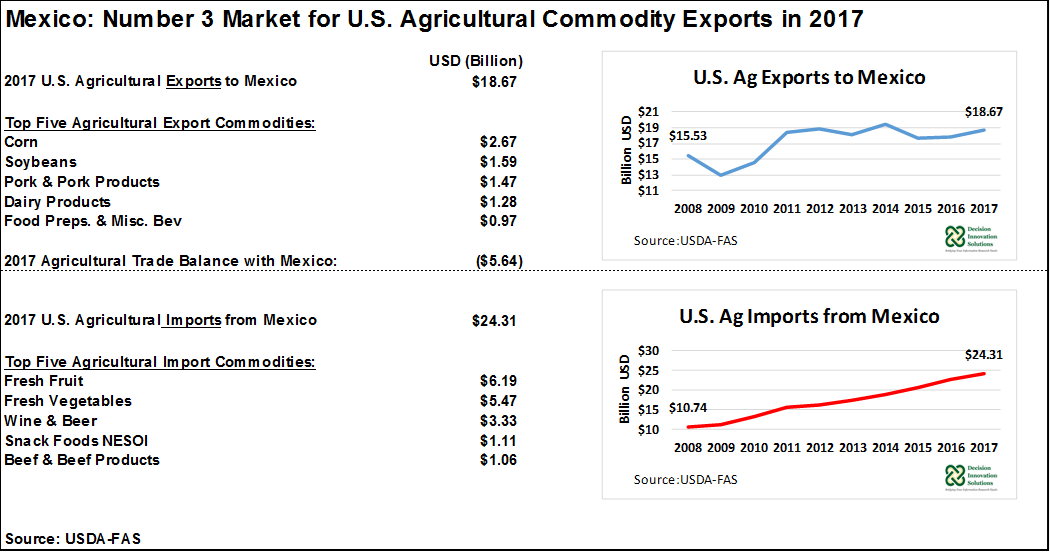
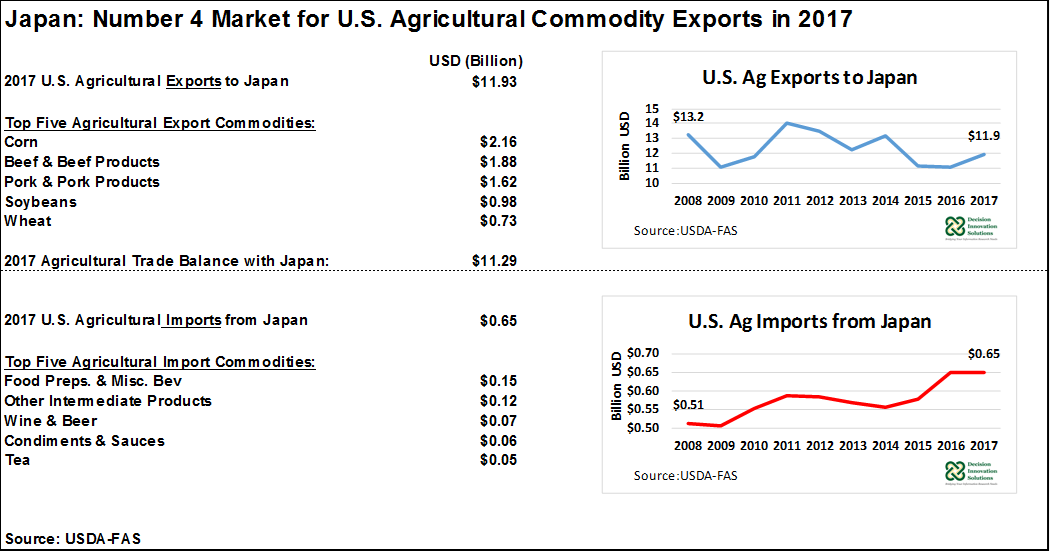
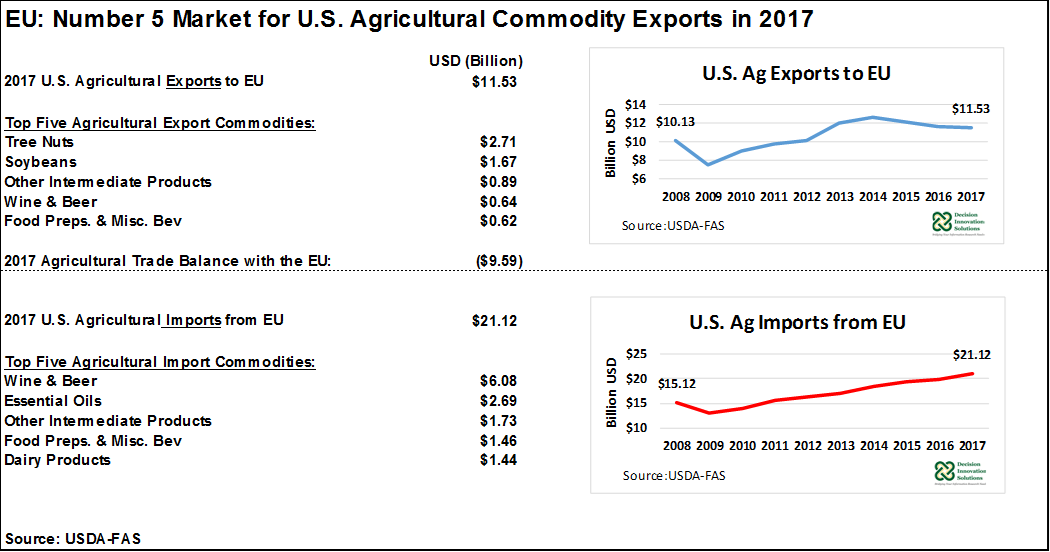
Over 20 percent of U.S. farm products by value are exported each year, making trade a key component for U.S. agricultural sustainability and growth. Canada finished as the United States’ leading export market in the 2017 calendar year, followed closely by China and Mexico. Also, important customers for U.S. agricultural products in calendar year 2017 were Japan and EU. These five markets made up about 60 percent ($82.3 billion) of the value of U.S. total agricultural exports ($138.5 billion). Depending on particular commodities, there were other key agricultural markets in 2017 calendar year. For instance, Colombia and Peru (corn’s 3rd and 5th leading markets, respectively), South Korea (2nd largest market for beef & beef products and 5th largest customer for both pork & pork products and dairy products), and Indonesia (a distant 5th largest market for soybean).
Overall, The United States was a net exporter (i.e., exports surpassed imports) of agricultural products in 2017 calendar year, with a trade surplus of $20.33 billion; however, the United States had an agricultural trade deficit (i.e., imports surpassed exports) with Mexico, Canada, and EU. These three countries were the United States’ largest suppliers of agricultural products ($24.3 billion, $22.3 billion, and $21.1 billion in 2017, respectively). Most of the U.S. agricultural imports from Mexico consisted of fresh fruits, fresh vegetables, and wine and beer. The top three agricultural products imported by the United States from Canada were food preparations & miscellaneous beverages, chocolate & cocoa products, and fresh vegetables. The bulk of U.S. agricultural imports from the EU was U.S. imports of wine & beer and food preparations & miscellaneous beverages. Details of overall U.S. agricultural trade as well U.S. trade with the top five markets is presented below.
This article is part of a report originally published here.

