

March 31, 2015 is the deadline for producers to make the final election of program coverage under the current Farm Bill (2014-2018). As this is an irrevocable election for the duration of the current Farm Bill, producers may want to gather as much information as possible pertaining all risk related to yields and prices. The election for producers is between the two versions of the Agriculture Risk Coverage (ARC) program (i.e., ARC County €“ARC-CO and ARC Individual at the farm level) or the Price Loss Coverage (PLC) program. If no election is made by the producer, there will be no payments for 2014. Starting in 2015, the default elected program will be PLC.
On February 19, 2015 the USDA/National Agricultural Statistics Service (NASS) released the 2014 county corn and soybean yields. With this information, the 2014 payment estimation for the ARC-CO program can be fine-tuned a bit more, as previous payment estimates were based on projected 2014 yields.
ARC-CO provides payments when the actual county crop revenue falls below the ARC county guarantee. ARC-CO county guarantee is equal to 86% of the benchmark county revenue. The benchmark revenue is equal to the five-year Olympic average yield (i.e., preceding five-year average county yield, excluding the years with the highest and lowest yield), times the five-year Olympic average of Market Year Average (MYA) price (i.e., previous five-year average national price, excluding the years with highest and lowest price). ARC-CO payment is equal to 85% base acres times the amount by which the guarantee is above the actual revenue. The payment is up to 10% of the benchmark county revenue. In contrast, PLC makes payment when the national average price falls below a fixed reference price ($3.70/bushel for corn and $8.40/bushel for soybeans). The PLC payment is equal to 85% of the base acres times the difference between reference price and the national average price times the payment yield.
Some of the work we do at Decision Innovation Solutions (DIS) is analyzing and quantifying the effect of agricultural policies on Iowa producers. We present in this report part of the work we have been doing regarding the ARC and PLC policies and how these policies perform differently across Iowa counties. To show how the ARC-CO and PLC programs perform differently even for counties located within the same Iowa crop reporting districts, we will present corn 2014 payment estimates for two north central Iowa counties (Hancock and Humboldt) and two south central Iowa counties (Marion and Monroe). The corn prices used here to estimate 2014 payments are in the range of $3.40 to $3.90. These prices were the World Agricultural Supply and Demand Estimates (WASDE)/USDA market year average (MYA) price projections published on February 2015. The final corn MYA price for 2014/2015 will be released by the USDA by the end of September 2015.
Even though PLC payments have to be calculated based on producers' payment yields, the 2014 PLC payments were estimated using county average yields and assumed updated payment yields (i.e., 90% of average county yield for 2008 to 2012). These estimates can be useful for those producers whose payment yields are about 90% of their county yield average from 2008 to 2012. The payments are presented here as an illustration of the size of PLC payments under these conditions and to contrast with the estimated ARC-CO payments.
All the selected counties had a 2014 corn yield higher than their previous year yield; nonetheless, the yield percent increase was different from county to county. Hancock County and Humboldt County 2014 corn yields were up 2% and 14% from a year ago, respectively, whereas Marion County and Monroe County 2014 corn yields were 15-year record high yields. Marion County 2014 corn yield was 10% above last year yield and Monroe County 2014 corn yield was 52% above its previous year yield.
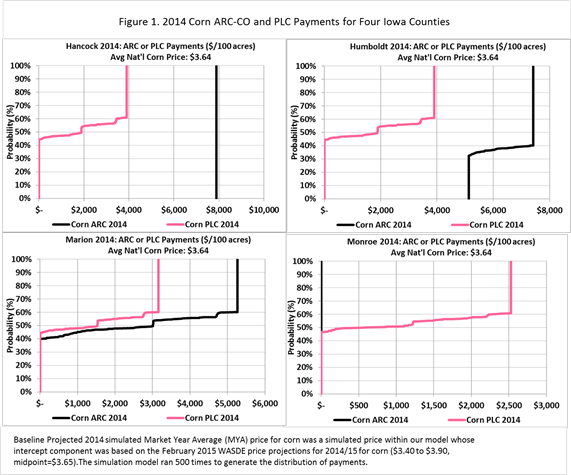
Using a Cumulative Distribution Function (CDF), Figure 1 shows the distribution of payments under ARC-CO and PLC for four Iowa counties. The Figure indicates that 2014 payments for Hancock, Humboldt, and Marion are larger under ARC-CO than PLC (ARC-CO line is the same or further to the right at all probabilities); however, the payments for each of these counties are different. For Hancock County, the payment is equal to $78.91/acre for all MYA prices within the price range ($3.40-$3.90). The actual revenue at $3.40 MYA price is equal to $591 (173.9*3.40); the actual revenue at $3.90 MYA price is $678 (173.9*3.90). In both cases the difference between the actual revenue and the guarantee ($798, or $928*86%) is larger than the 10% benchmark revenue limitation ($928*10%=$92.80); therefore, payments for Hancock County are estimated at 78.91/acre (85% base acres times 10% the benchmark revenue). The benchmark revenue is a fixed value since prices and yields to estimate the benchmark are based on historical data (2009-2013).
In the case of Humboldt County, ARC-CO payments go from about $51.36 per acre to about $74.16 /acre. Actual revenue at $3.90 MYA price is about $689.91 (176.90*3.90) compared to the guarantee equal to $750.33. Since the difference ($60.42) between the actual revenue and the guarantee is below the 10% benchmark county revenue (10%*$872=$87.20) limitation, the payment (about $51/acre) is estimated as 85% base acres times the difference between the guarantee and actual revenue. At the $3.40 MYA price, the difference ($148.87) between the guarantee ($750.33) and actual revenue ($601.46) increases, and is above the 10% benchmark revenue ($87.25); therefore, the ARC-CO payment ($74) is estimated as 85% base acres times 10% benchmark revenue. In between these two prices there are other payments corresponding to prices that fall within the price range.
In the case of Marion County, ARC-CO payments max out at $52.71/acre at the lowest MYA price ($3.40) within the range and there are no payments when the MYA price reaches about $3.77/bushel. Finally, Monroe County with a 2014 record yield of 175.7, has no 2014 ARC-CO payments, as county revenue exceeds the county guarantee ($501) at all price levels within the MYA price range of $3.40 to $3.90. Monroe County's producers whose payment yields are about the same as the 90% of average county yield from 2008 to 2012 (99 bushels/acre) are better off under the PLC program for 2014, as there are payments for MYA prices between $3.40 ($25.30/acre) and $3.69 ($0.80/ acre); however, the latest WASDE reported (March 2015) projected a 2014/2015 MYA corn price within the range of $3.50 to $3.90, trimmed $0.10 at the lower end compared to the February MYA corn price range projection. The midpoint was $3.70/bushel in which case, which means there are no expected 2014 PLC payments.
Overall in 2014, counties with previous five-year history (2009 to 2013) of high yields but whose 2014 yield was lower than the previous 5-year average could do well under ARC-CO for 2014, as the guarantee will tend to be larger than the actual revenue. Conversely, counties with low previous five-year average yields but whose 2014 yield was higher than the previous five-year average will not do as well under ARC-CO for 2014. However, ARC-CO has two risk components, county yields and MYA prices, and only one of these components is known so far to estimate the 2014/2015 payments. Until 2014/2015 MYA prices are known by the end of September 2015, 2014 ARC-CO payments cannot be accurately estimated. The estimates shown here are intended to show how payments are calculated and how these payments vary among different Iowa Counties. Final decisions about program election should take into consideration all risk related to yield and price outcomes.
Additional information related to the impact of various MYA prices for corn and soybeans on estimated county 2014 ARC-CO and PLC payments please visit this link.