

Agriculture is a favorite target among those looking for somewhere to place blame for greenhouse gas emissions. However, recent research from the Environmental Protection Agency (EPA) shows that agriculture has made more progress in cutting emissions than any other industry in the US. According to the report, “Inventory of US Greenhouse Gas Emissions and Sinks: 1990-2022”, US greenhouse gas emissions increased from 2021 to 2022 by +1.3% but agricultural emissions dropped -1.8%.
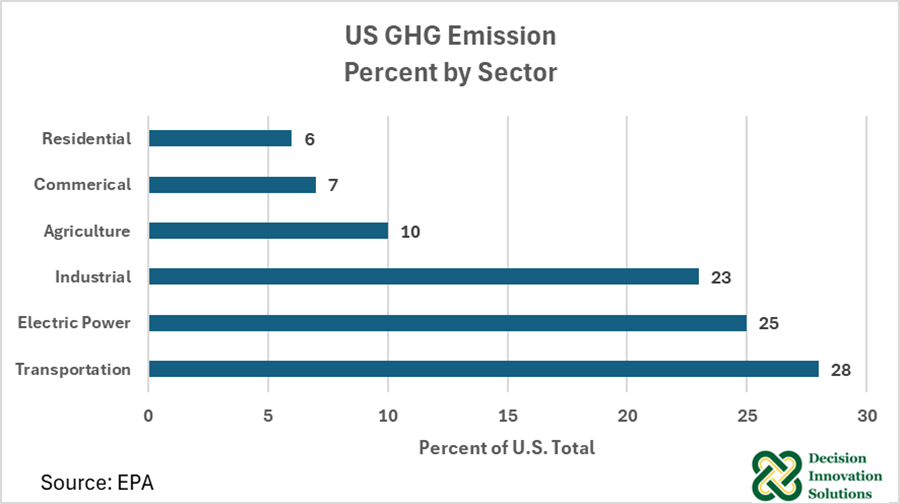
EPA’s report shows emissions from agriculture totaled 634 million metric tons in CO2e (Carbon Dioxide equivalents), or 9.99% of all U.S. emissions, during 2022. This represents a decrease of 12 million metric tons, or -1.8%, from 2021, while marking the lowest US agricultural greenhouse gas emissions since 2012. That also puts agriculture’s contributions to total US emissions behind transportation (28%), electric power (25%) and the industrial sector (23%), though slightly ahead of the commercial sector (7%) and the residential sector (6%).
US agricultural greenhouse gas emissions include sources such as livestock enteric fermentation and manure management, N2O (Nitrous Oxide) emitted from managed agricultural soils from fertilizers and other management practices, and fossil fuel combustion from agricultural equipment. Indirect emissions from electricity in the agricultural sector are about 5% of sector emissions.
In 2022, agricultural soil management was the largest source of N2O emissions. Nitrous oxide (N2O) is produced by biological processes that occur in soil and water and by a variety of anthropogenic activities in the agricultural, energy, industrial, and waste management fields. While total N2O emissions are much lower than CO2 emissions, N2O is 265 times more powerful than CO2 at trapping heat in the atmosphere over a 100-year time frame. And while agricultural soil management represents approximately 50% of all agricultural emissions, it’s only 4.6% of total U.S. emissions.
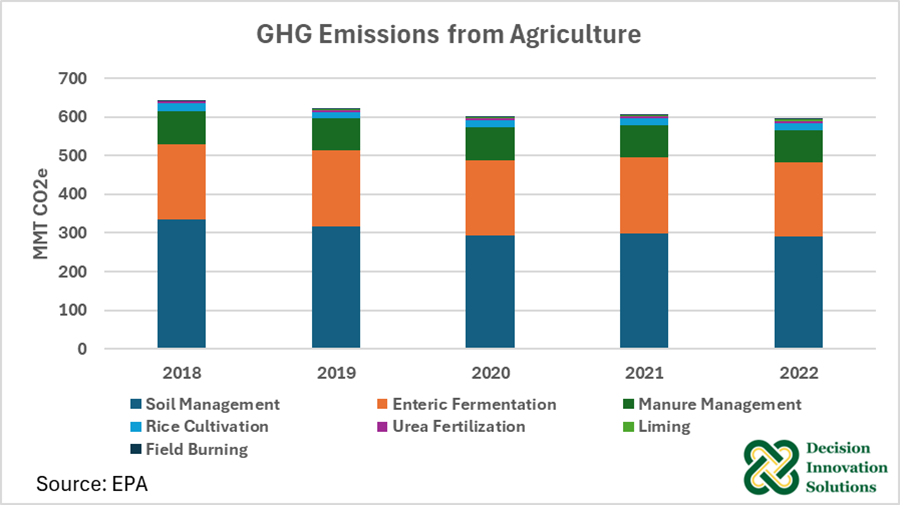
Emissions from soil management dropped 12.8% from 2018 through 2022. Enteric fermentation emission declined 2.1%, emissions from manure management declined 3.1%, emissions from rice cultivation declined 5.0%, and emission from field burning were unchanged. Emissions from urea fertilization and liming were up 0.4 MMT CO2e and 1.1 MMT CO2e, respectively.
Overall, N2O emissions in the United States in 2022 accounted for 398.8 MMT, representing a decrease of -3.4% since 1990 and a decrease of -2.5% since 2021. N2O emissions from agricultural soil management increased by +0.7 % from 1990 to 2022. However, that compares to a more than +10% increase from “stationary combustion”, the second largest source of N2O emissions in 2022, and a nearly +50% increase in the wastewater management sector, the third largest source of N2O emissions.
Enteric fermentation was the largest source of CH4 (Methane) emissions in the United States in 2022. From 1990 to 2022, emissions from enteric fermentation have increased by +5.2%, according to EPA. However, from 2021 to 2022, emissions decreased by -2%, largely driven by a decrease in beef cattle populations.
Overall, livestock-related emissions from enteric fermentation and manure management contributed 192 million metric tons and 82 million metric tons, respectively, to total US emissions. These two emission sources represented 46% of agricultural emissions, but only 4.3% of total U.S. emissions.
Other agricultural emission sources include methane from rice cultivation at 19 million metric tons, CO2 from urea fertilization at 5.3 million metric tons, CO2 from liming at 3.3 million metric tons, and CO2 from field burning at 0.8 million metric tons. Combined, these remaining categories represented less than 5% of agricultural emissions and 0.4% of U.S. emissions.
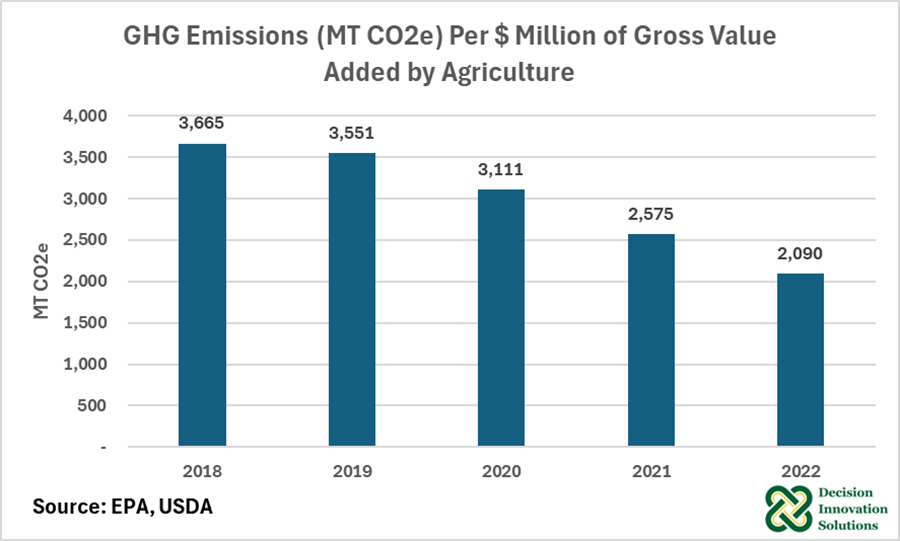
Another way to view “progress” on GHG emissions is to look at GHG emissions (measured as MT CO2e) per million dollars of value added to the economy. For agriculture, GHG emissions per million dollars of value added to the economy have decreased sharply over the past 5 years. In 2018, there were 3,665 MT CO2e of emissions per million dollars of ag value-added output. In 2022, the amount of GHG emissions per million dollars of value-added output had declined to 2,090 MT CO2e.
Agriculture is reducing its absolute GHG emissions while increasing output. This is a significant observation that needs to be kept in focus as policies are discussed and adopted with regards to “greening of the environment.” The food, fiber, and fuel that is produced by agriculture is contributing to the economic well-being of people around the world. And the output of agricultural production is being done with a continually improving environmental footprint.